Internship · IBM · Summer 2026
Design internship at IBM
Four projects on NS1 Connect, from a heuristic evaluation to bringing customer feedback into onboarding.
hi, I’m
UX design Product design Accessibility
I listen to real stories and bring human insights to the table so we can design
products, spaces and screens that make everyday life more accessible.
Featured project · Spring 2026
A smart event sticker that tracks hydration, blood alcohol and blood oxygen, so people can enjoy festivals and nights out without crashing.
Read the case study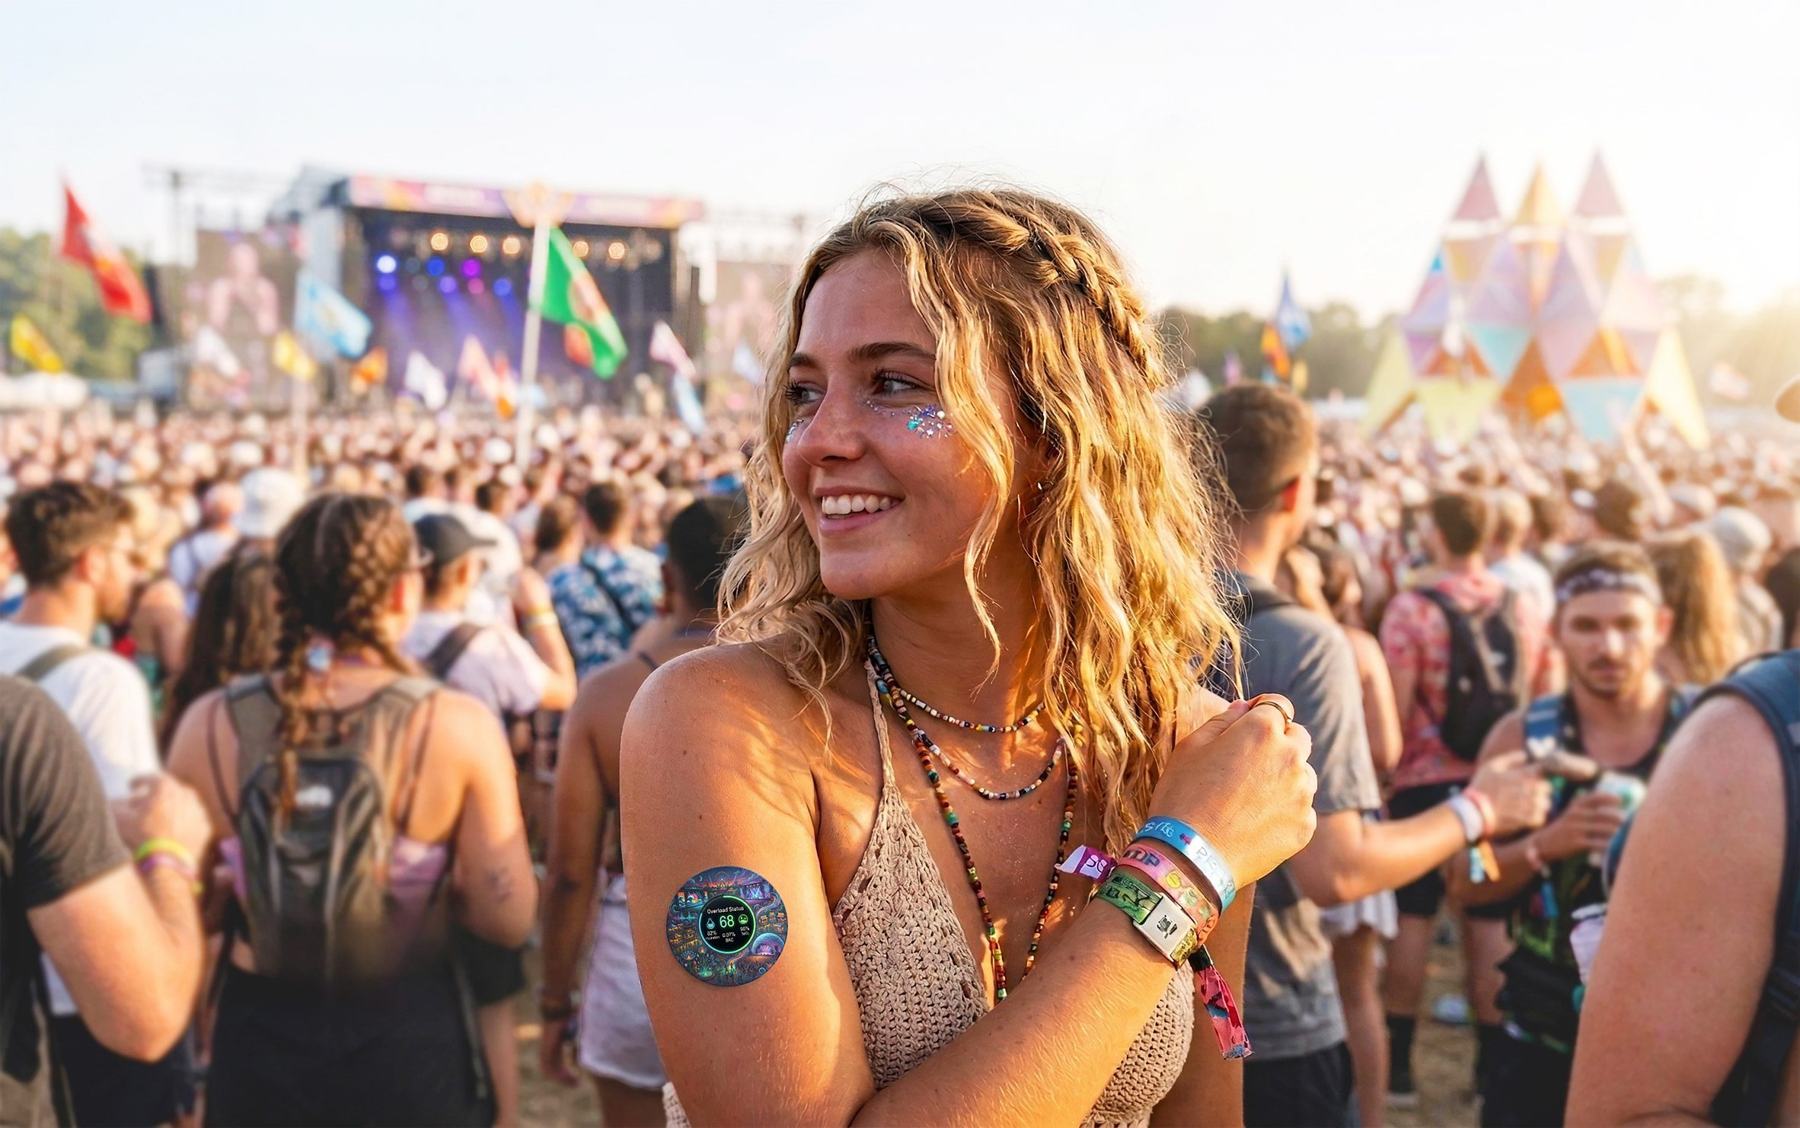
Internship · IBM · Summer 2026
Four projects on NS1 Connect, from a heuristic evaluation to bringing customer feedback into onboarding.
Industrial design · Spring 2026
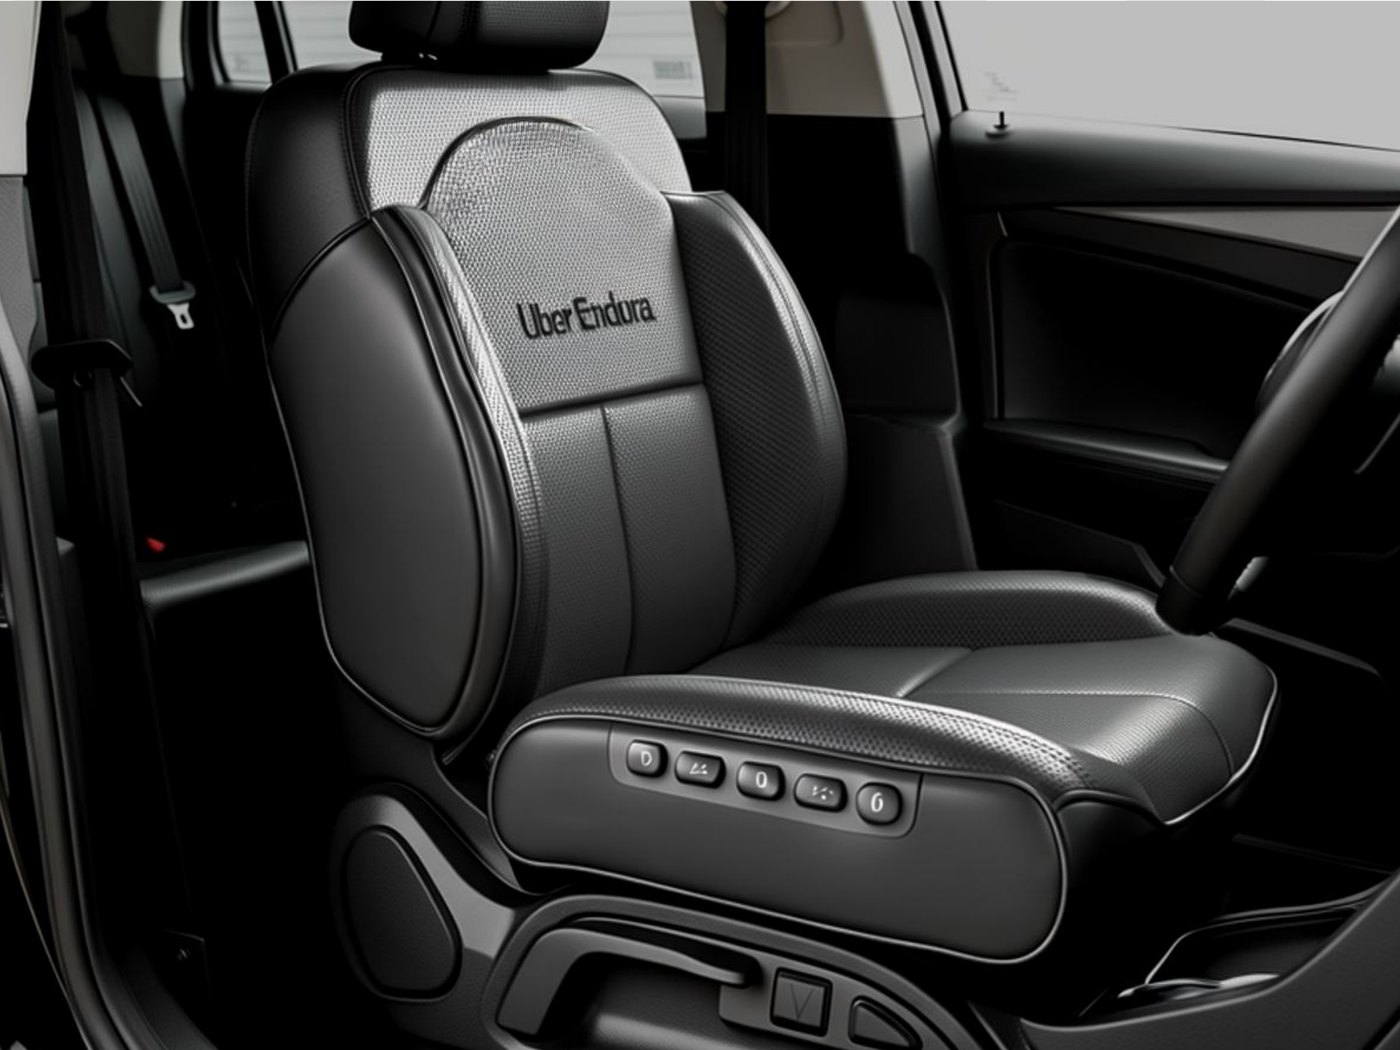
A seat cover for Uber drivers that responds to time behind the wheel and stress with support, pressure relief and massage.
Industrial design · Fall 2024
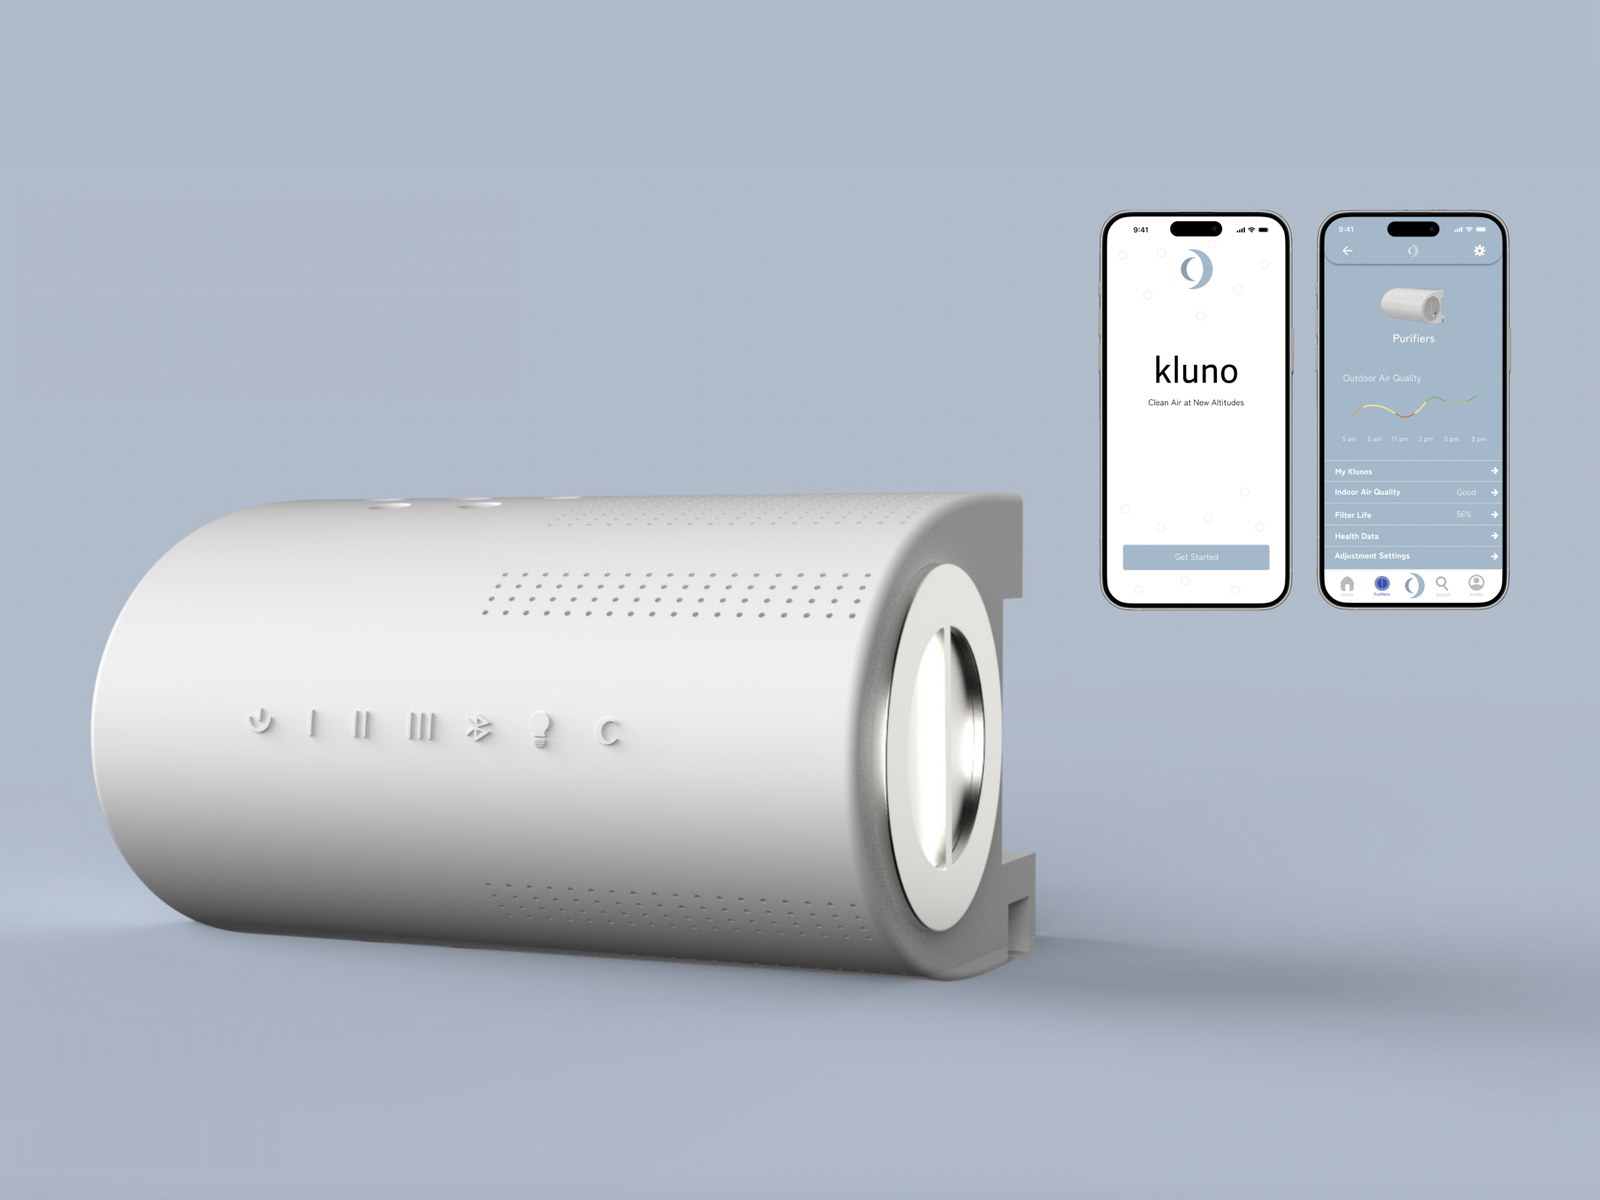
A smart air purifier that clips onto your window blinds to free up floor space, with an app to control it.
About
Senior at Georgia Tech pursuing a B.S. in Industrial Design.
I’m passionate about UX design. I challenge myself to see each project through the lens of accessibility, sustainability, and inclusive design.
More about meSelected projects · 2024–2026
Case studies from studio, my IBM internship and projects of my own. Each one starts with a question about people.
Featured · Spring 2026
A smart event sticker that tracks hydration, blood alcohol and blood oxygen, and taps you when it’s time for a break.
Internship · IBM · Summer 2026
Four projects on NS1 Connect, from a heuristic evaluation to bringing customer feedback into onboarding.
Industrial design · Spring 2026
A seat cover for Uber drivers that responds to time behind the wheel and stress with support, pressure relief and massage.
Industrial design · Fall 2024
A smart air purifier that clips onto your window blinds to free up floor space, with an app to control it.
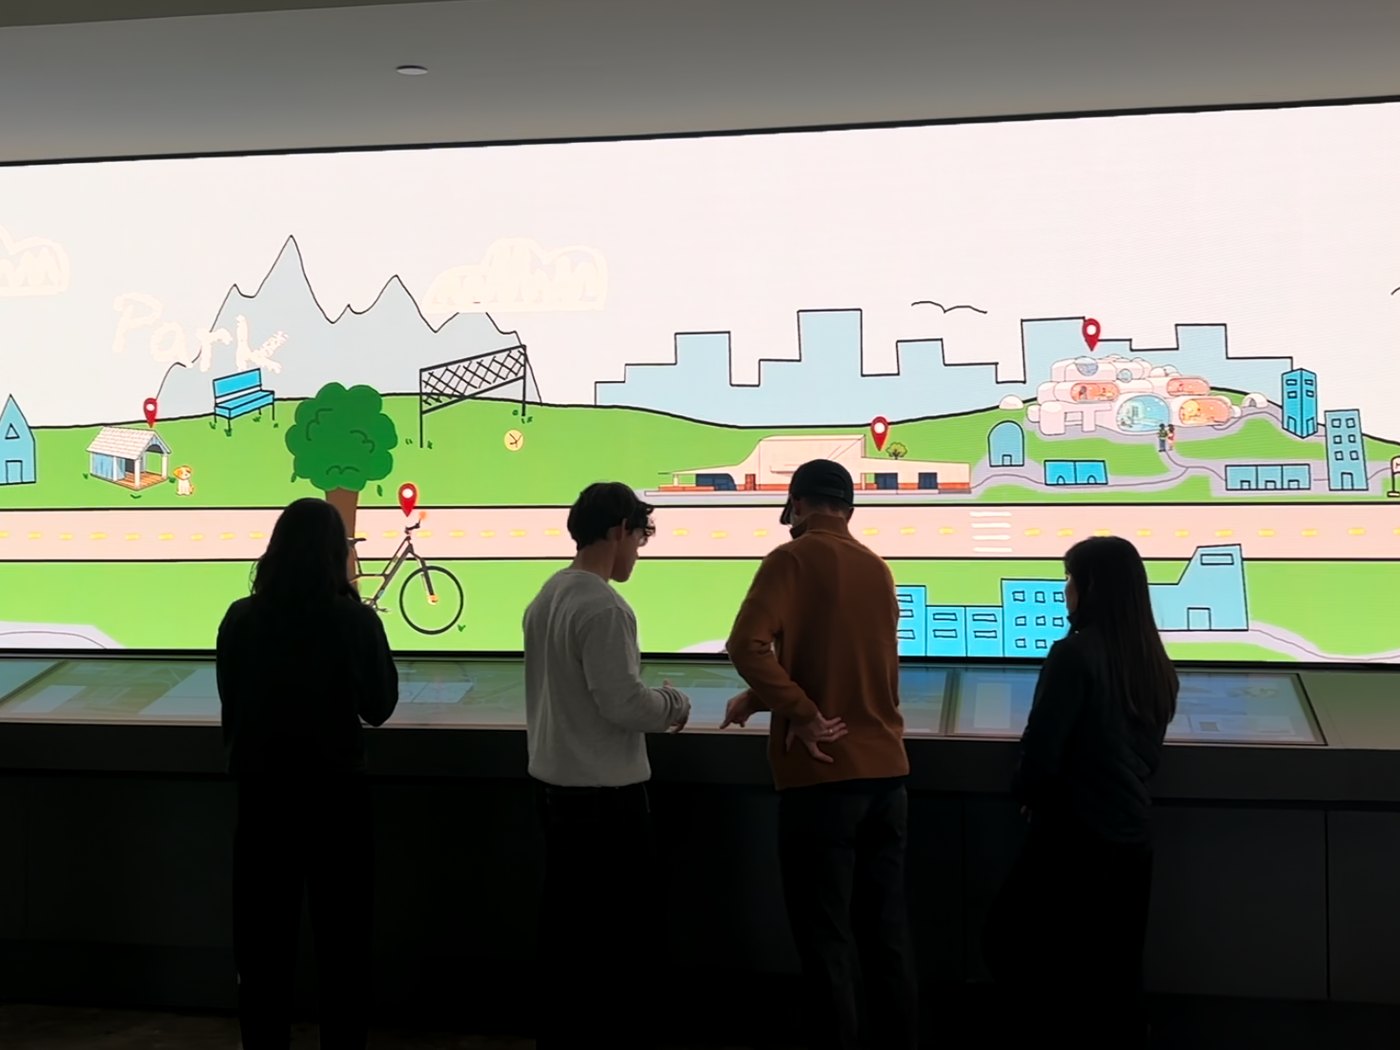
Experience design · Fall 2025
A hand-drawn College of Design city for the curved LED wall and touchscreens in Georgia Tech’s library.
Sketches · Models · Studies
The hands-on side of how I think: concept drawings, models and material studies from studio and my own time.
Case study · Spring 2026
All of the memories. None of the regrets.
A smart event sticker that tracks hydration, blood alcohol and blood oxygen, so people can enjoy festivals, concerts and nights out without crashing.
The problem
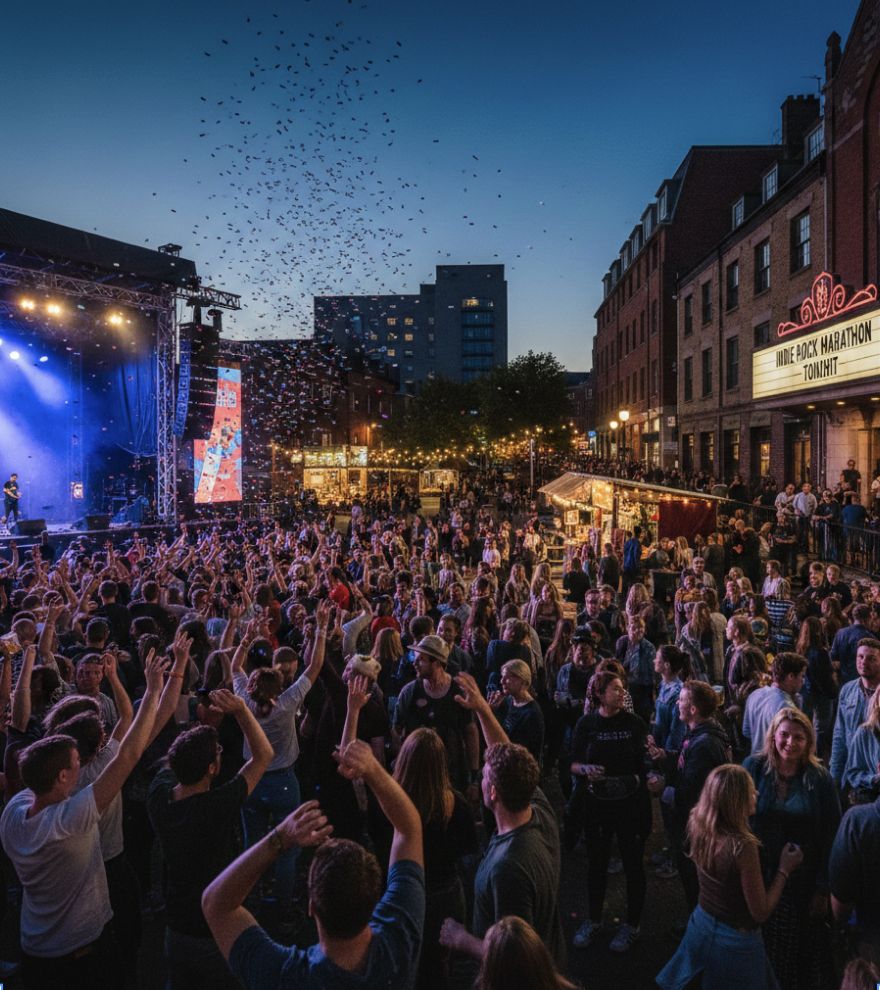
People often dismiss their health at high-energy social events, such as music festivals, concerts and bars, by prioritizing immediate, intense enjoyment over long-term physical well-being.
People attending long social events, such as festivals, concerts and nightlife. Any age, but mainly 18‑40.
These high-energy settings bring:
Research
I surveyed people who attend high-energy events about how they look after themselves while they’re there.
What might stop you from taking a break?
“If I don’t notice any feelings of discomfort then I won’t take a break, even if alcohol or excitement could be masking my discomfort.”
“It’s kinda embarrassing to say you need a break and I feel like people get overly worried.”
What kinds of prompts about your body would feel helpful, and which would feel annoying?
“Prompts to check in with my body would be helpful. Telling me to do something like drink water might feel annoying.”
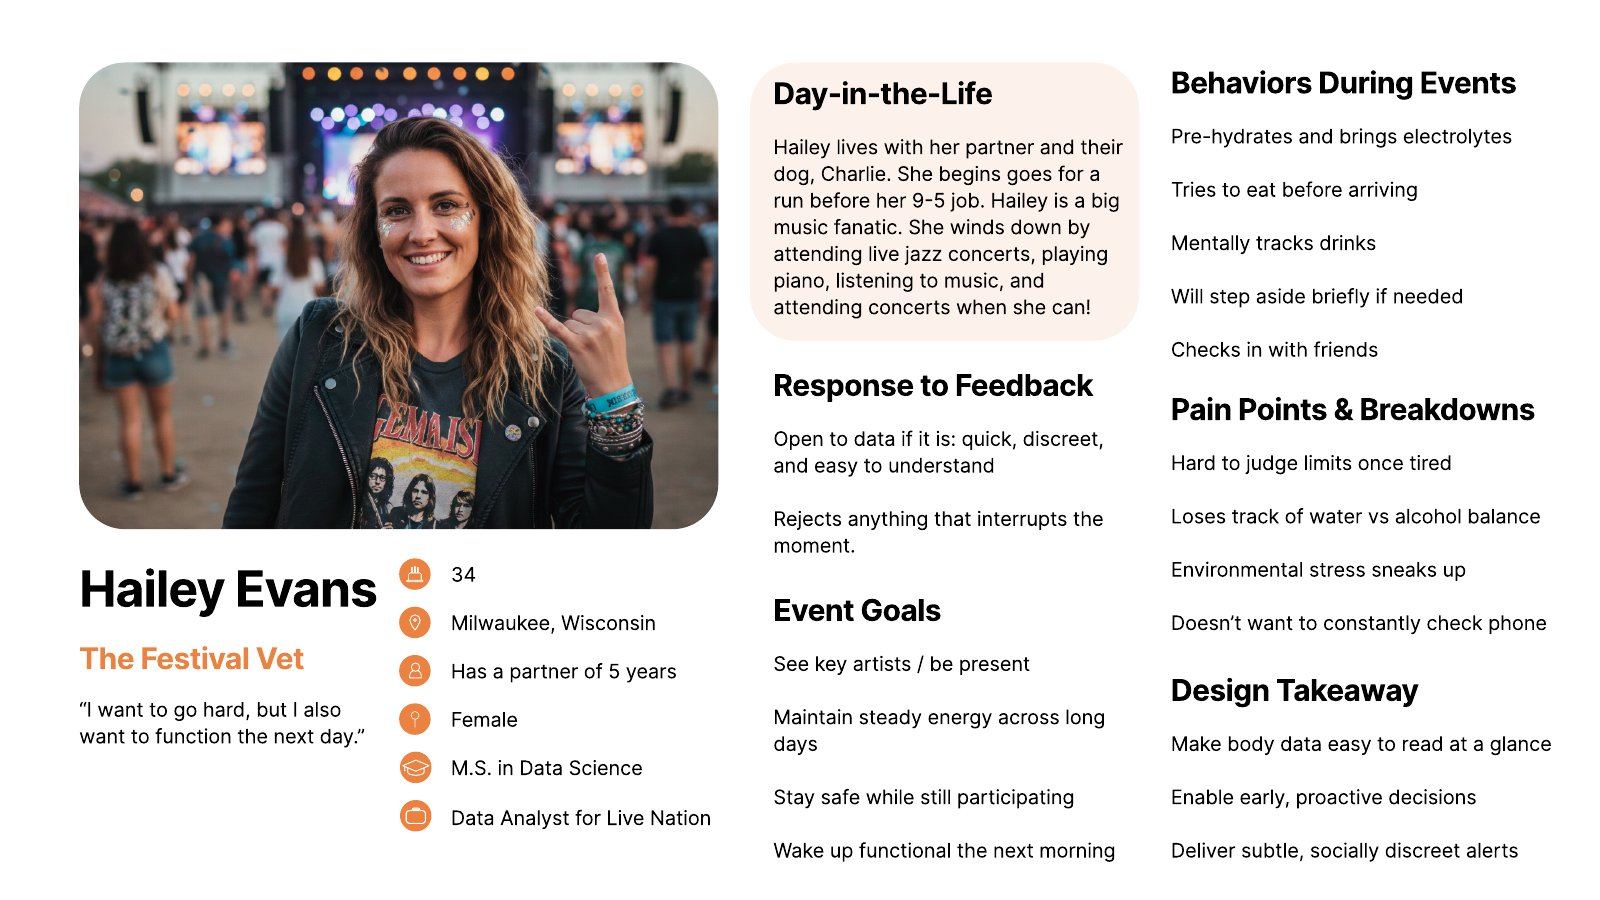
The Festival Vet
“I want to go hard, but I also want to function the next day.”
Hailey lives with her partner and their dog, Charlie. She goes for a run before her 9–5 job. She’s a big music fan and winds down with live jazz, playing piano and going to concerts whenever she can.
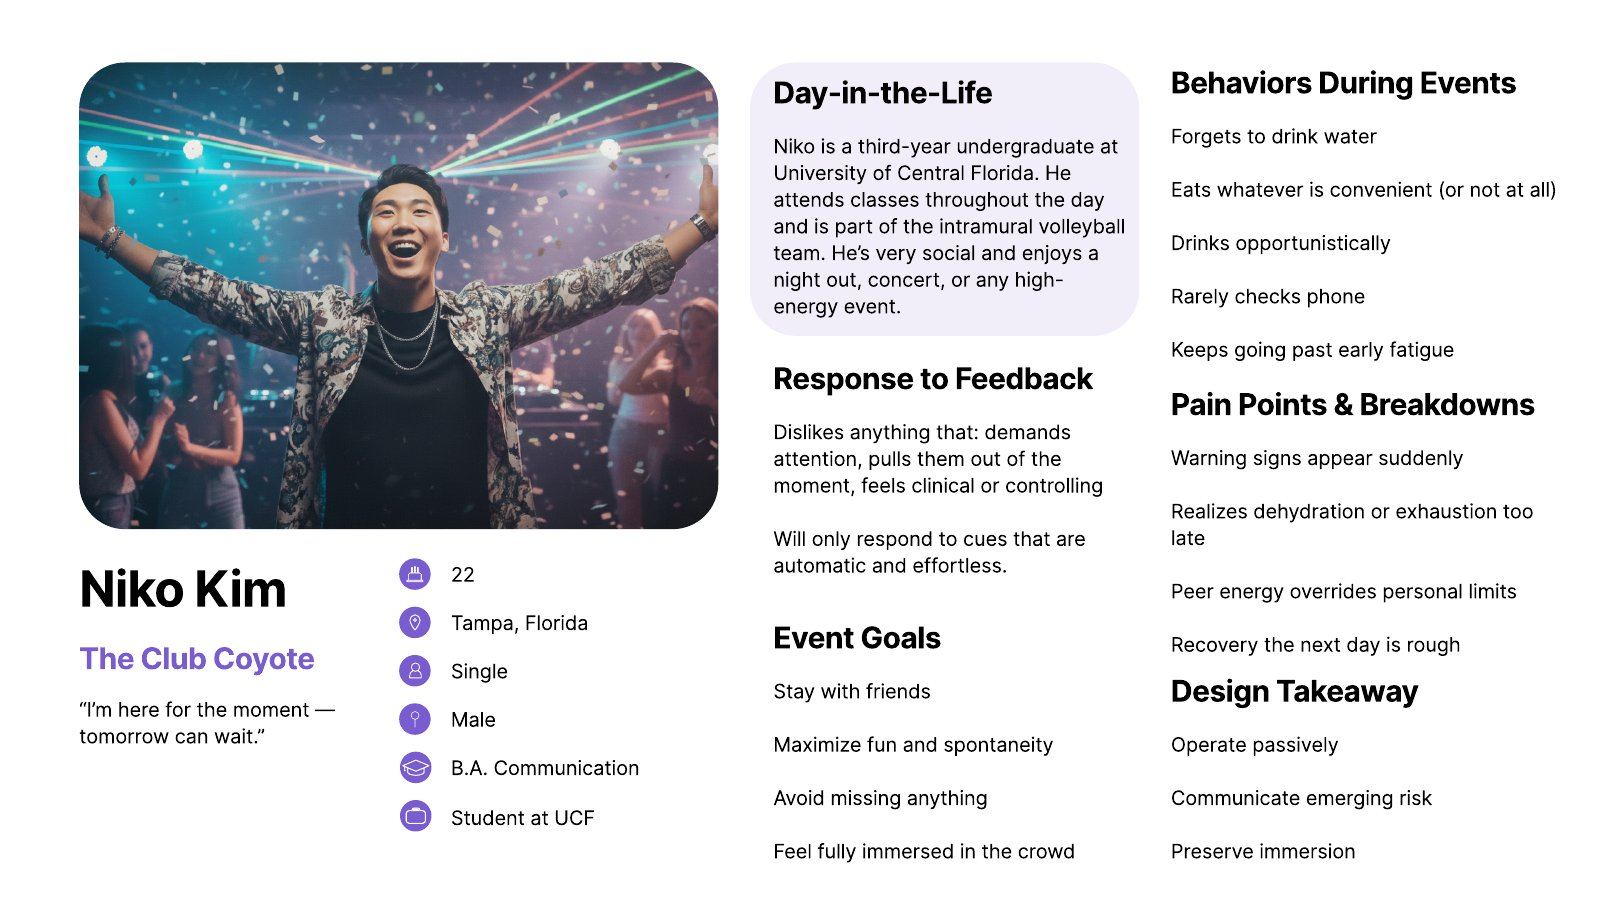
The Club Coyote
“I’m here for the moment. Tomorrow can wait.”
Niko is a third-year undergraduate at the University of Central Florida. He goes to classes during the day and plays on the intramural volleyball team. He’s very social and loves a night out, a concert or any high-energy event.
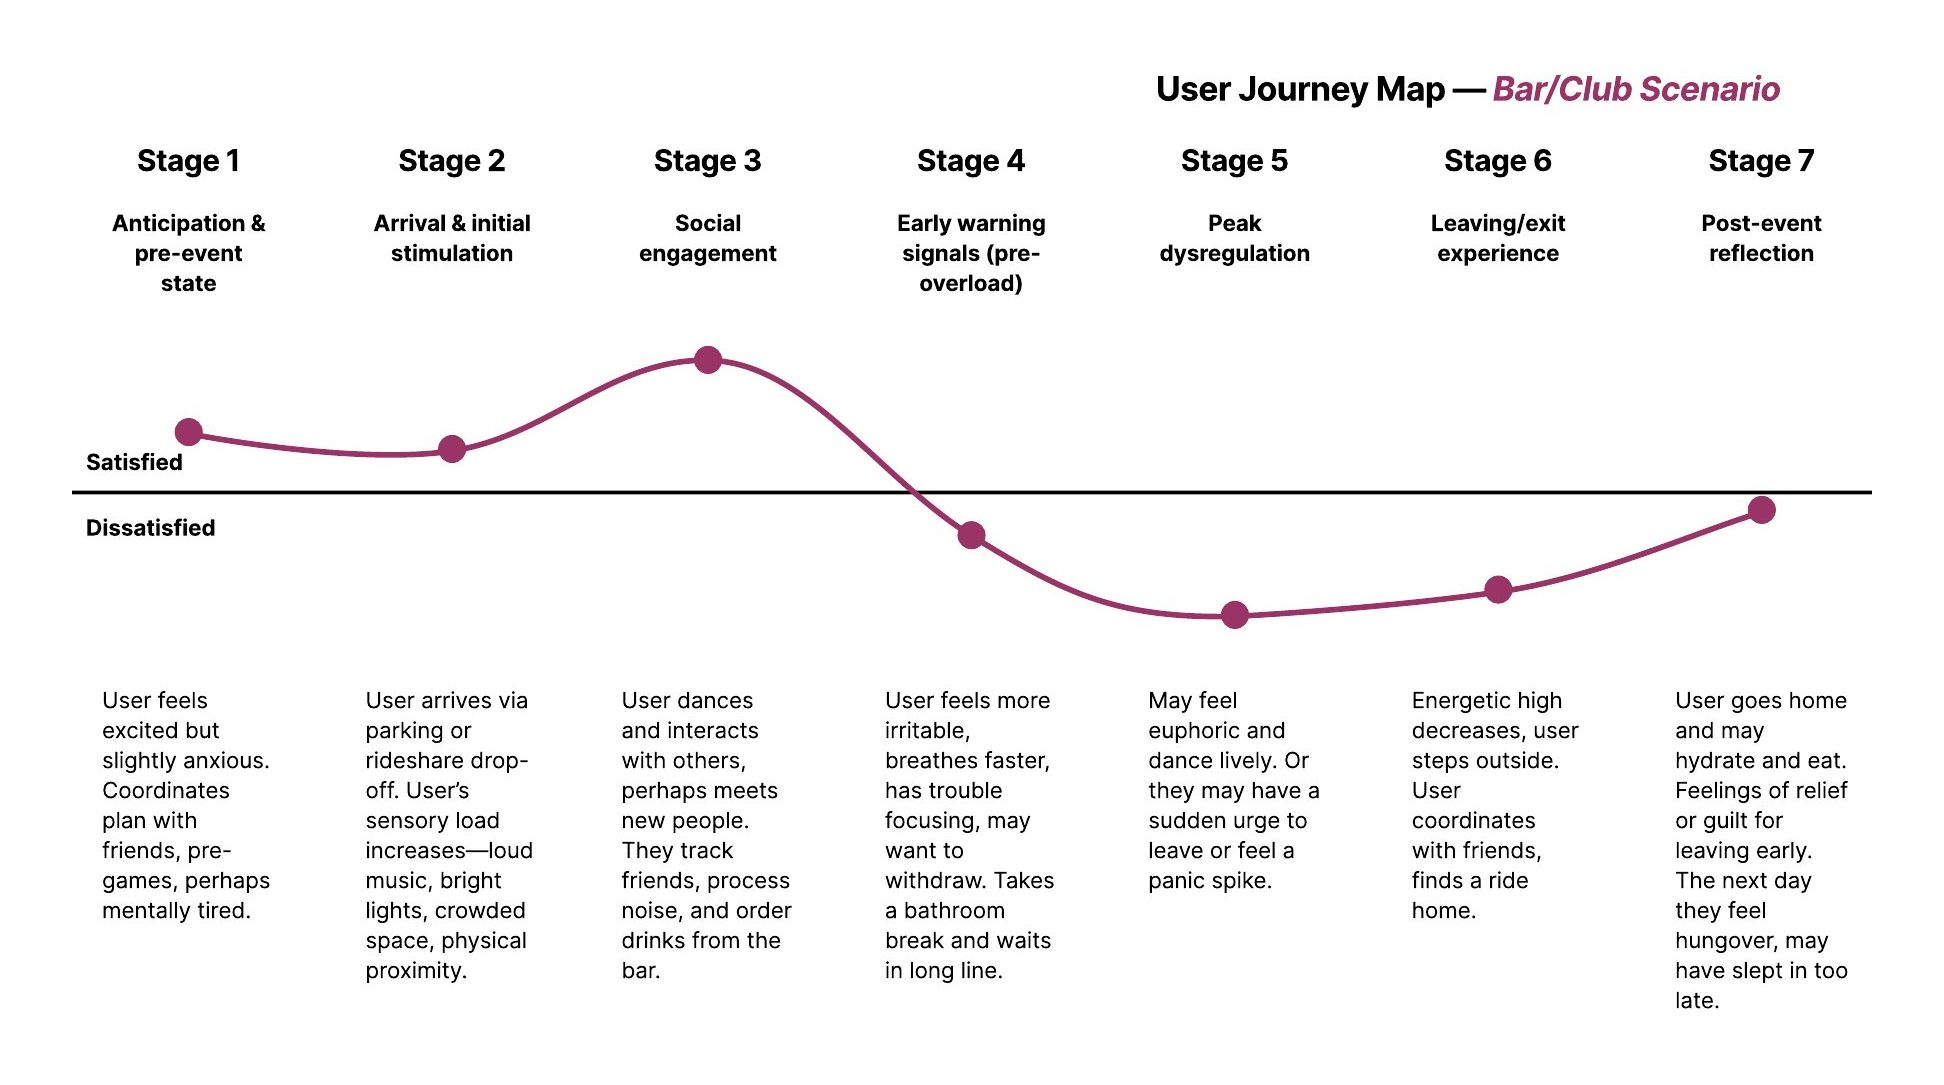
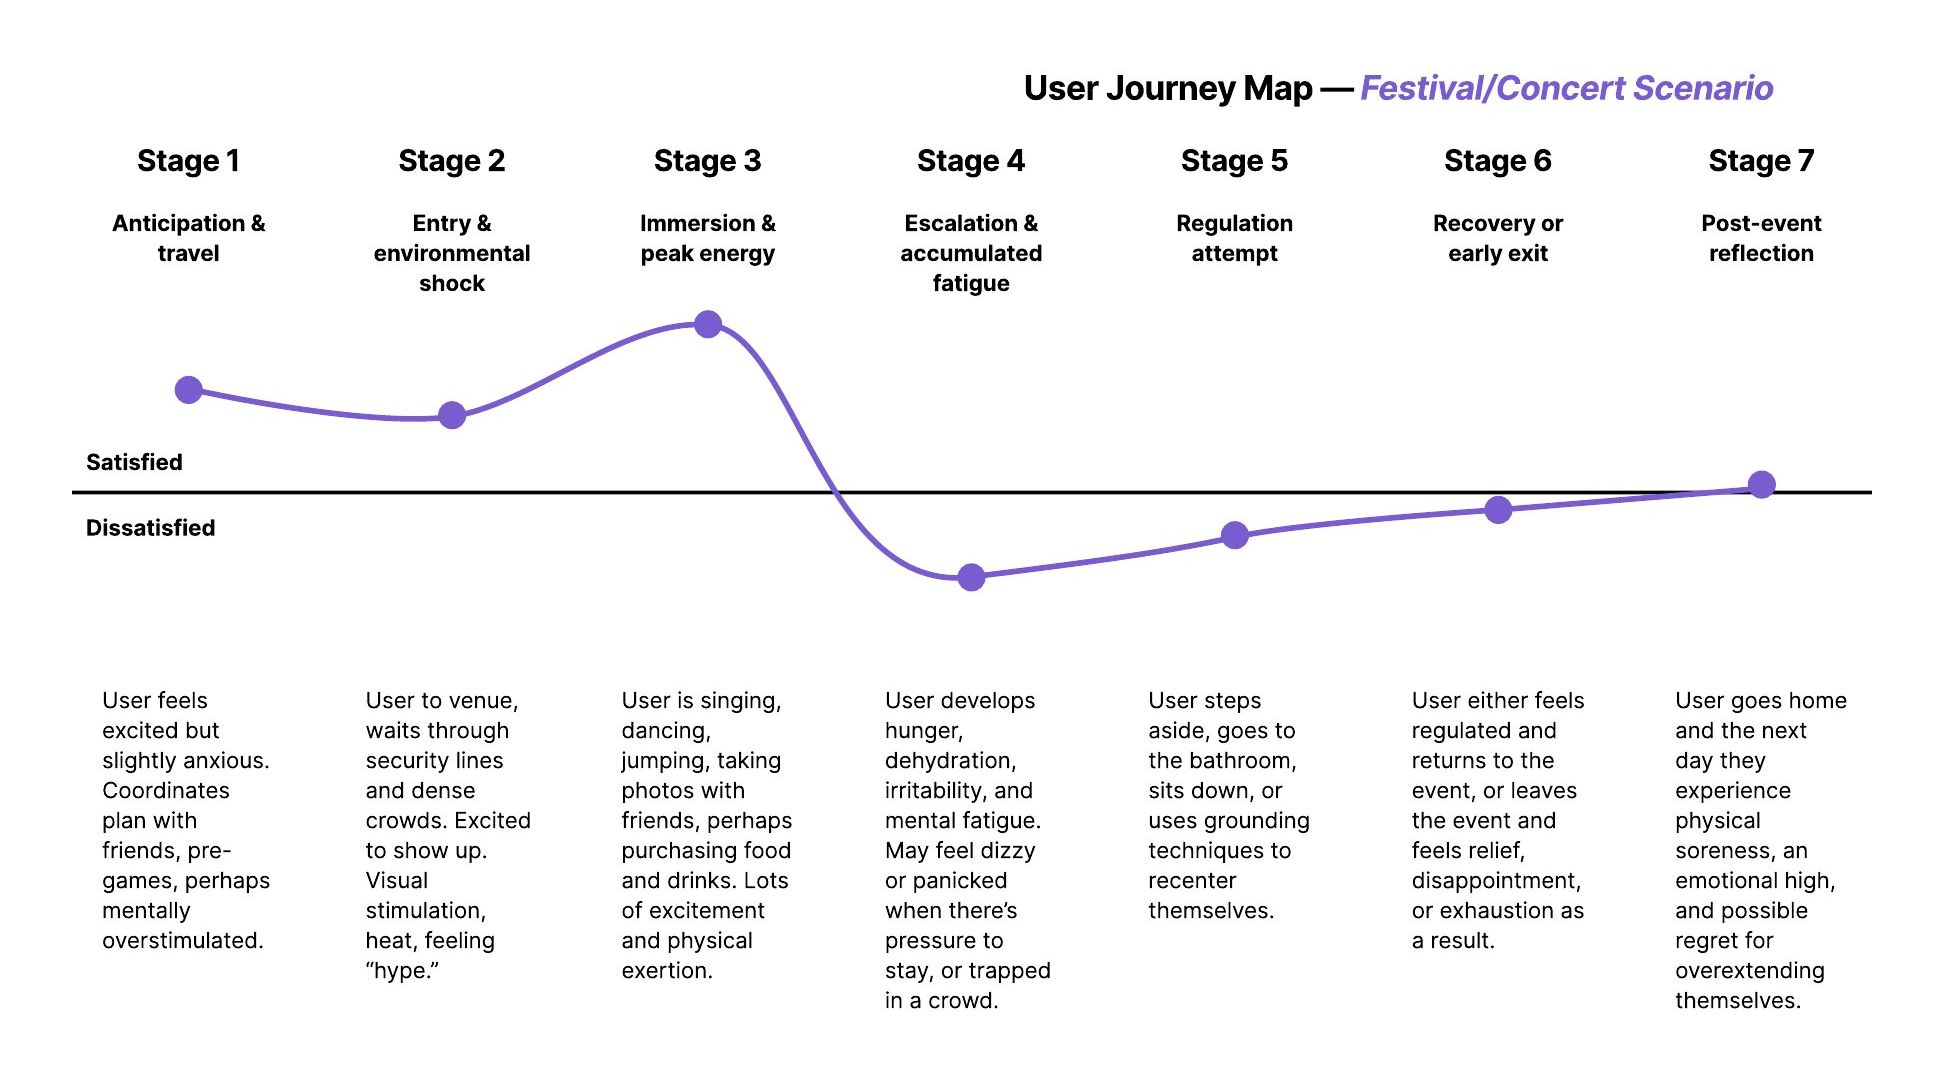
I mapped a bar or club night and a festival or concert across seven stages, from anticipation to post-event reflection. Both follow the same curve: excitement builds to a peak of social energy, then drops sharply as early warning signs appear, and people either leave early or push through and regret it the next day.

Taking a break, a person sits down and suddenly crashes: shaky legs, a pounding head and extreme fatigue.
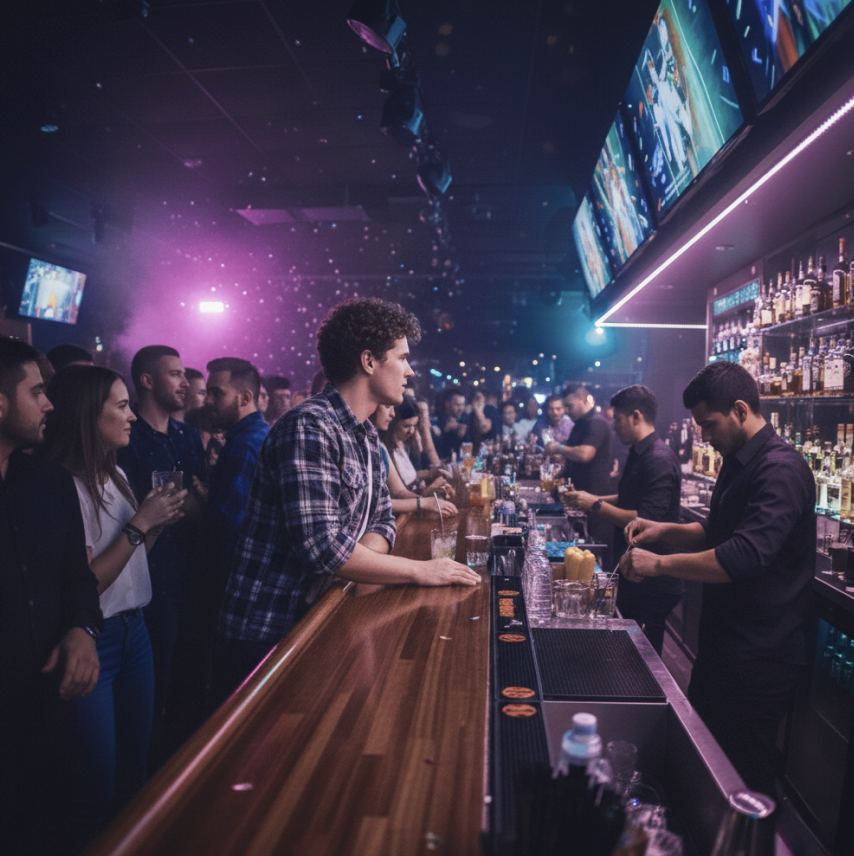
Thinking their last drinks are wearing off, a person orders another. Adrenaline hides the overload, and no one steps in.
The opportunity

Design objective
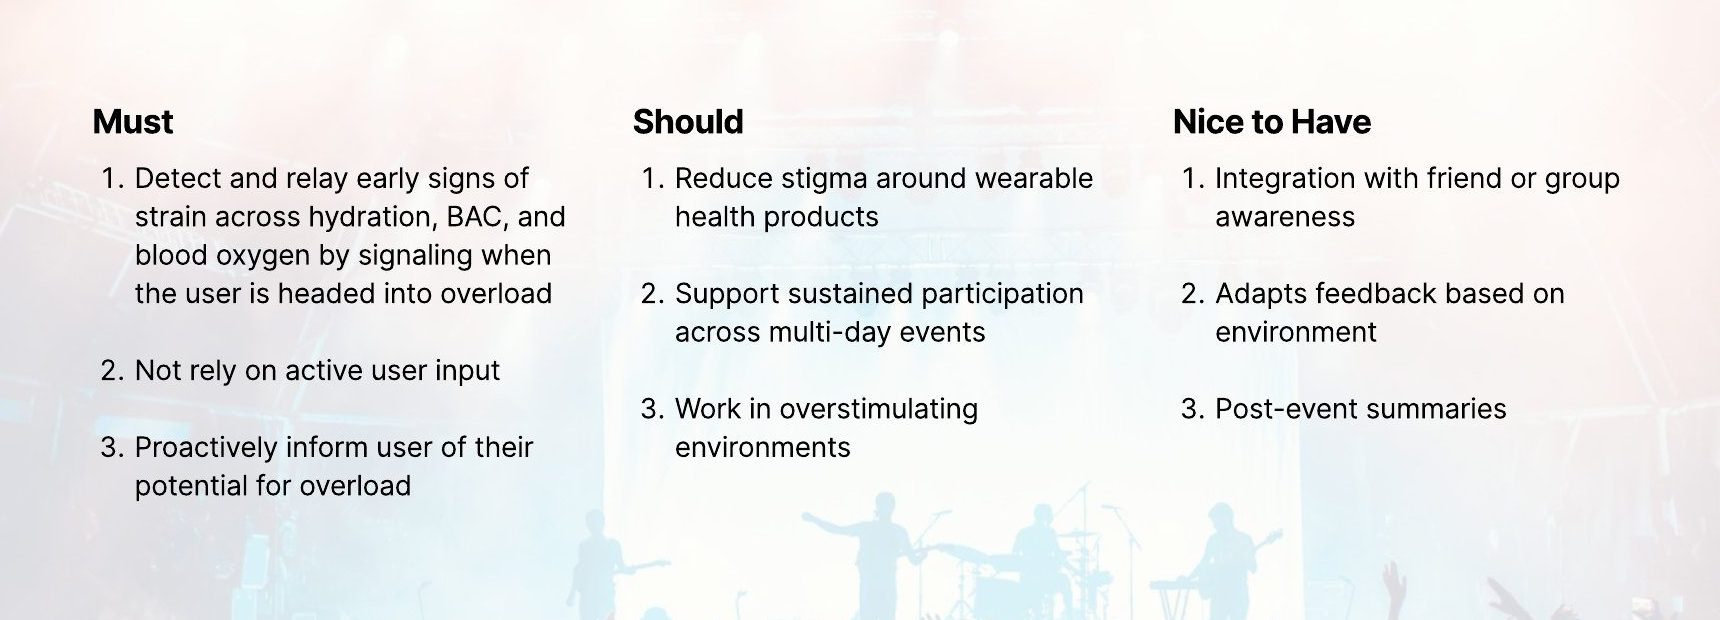
To enable individuals in high-energy leisure environments to become aware of hidden physical stress by tracking hydration, BAC, and blood oxygen levels.
Heat, dancing and alcohol drain fluids fast.
Today: bulky, slow checks that react too late
Shapes judgment, balance and risk-taking.
Today: breathalyzers that interrupt the moment
Drops with heat, crowds and exhaustion, even when you feel fine.
Today: readings lost to motion or buried in apps
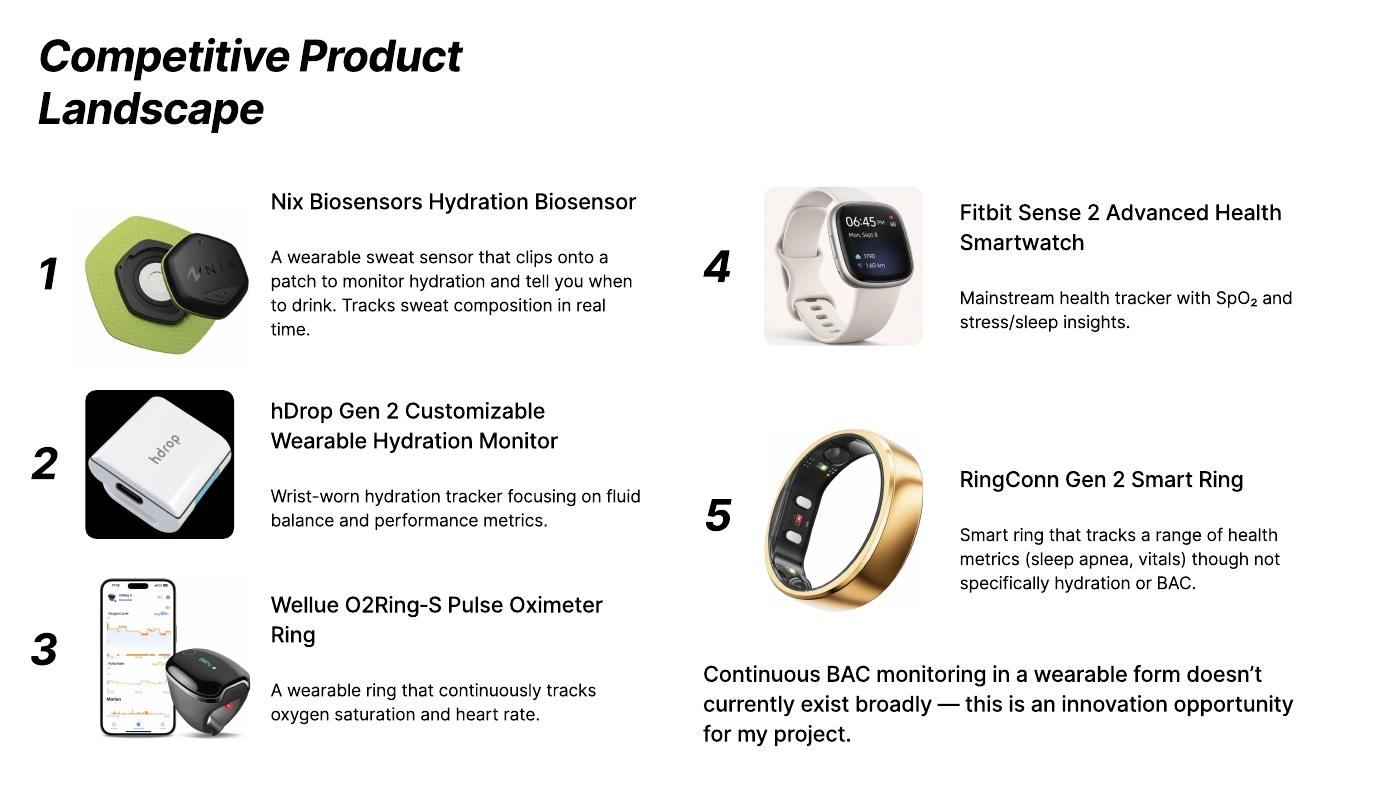
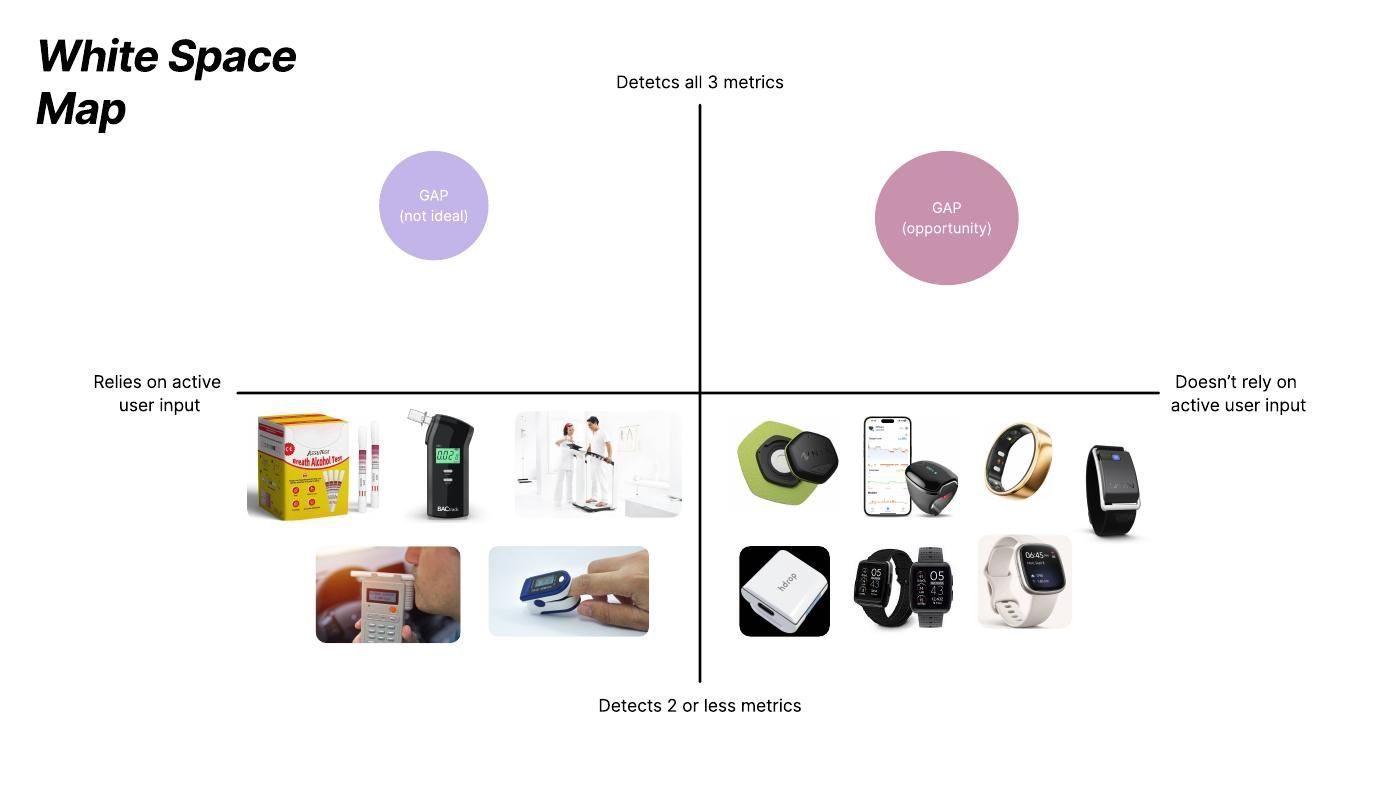
Continuous BAC monitoring in a wearable form doesn’t broadly exist yet, which made it the innovation opportunity for this project.
Ideation
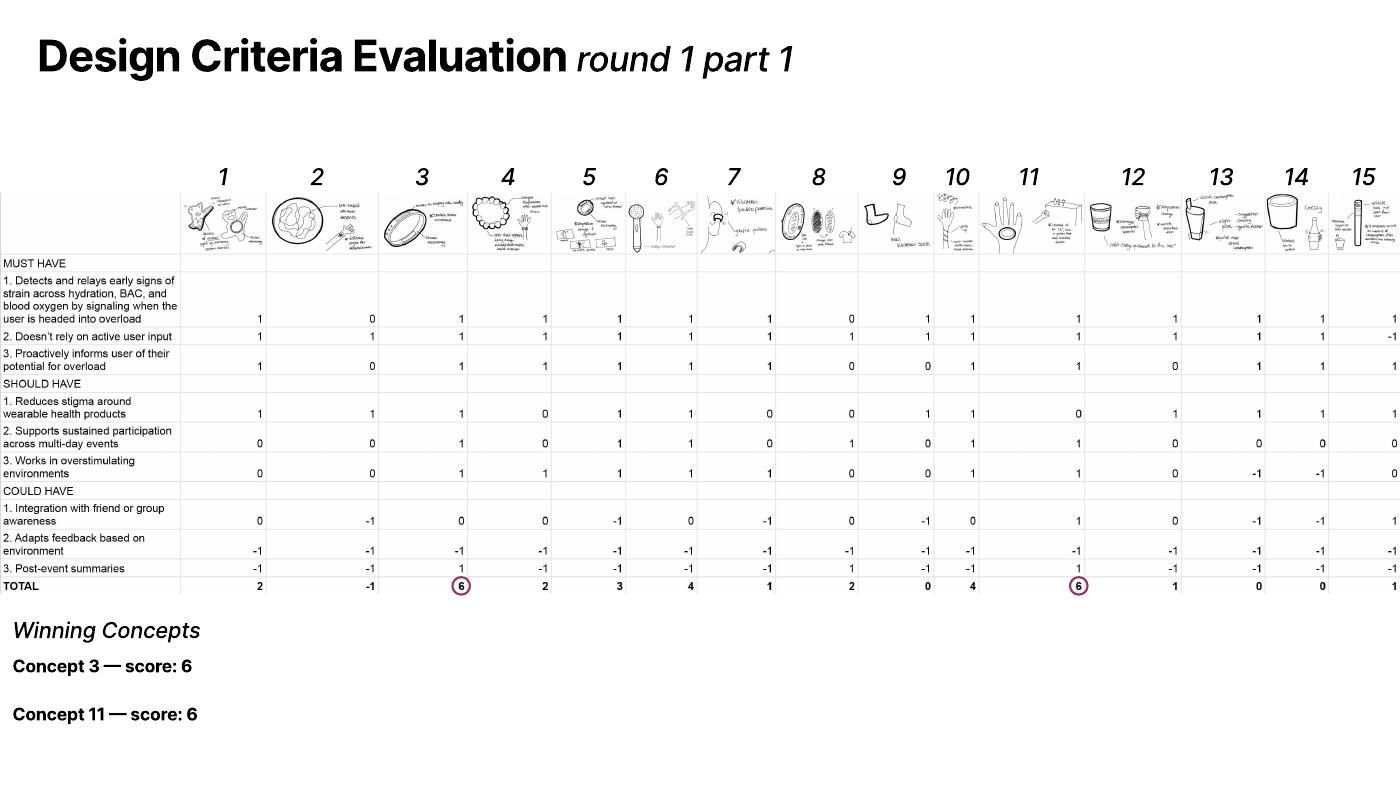
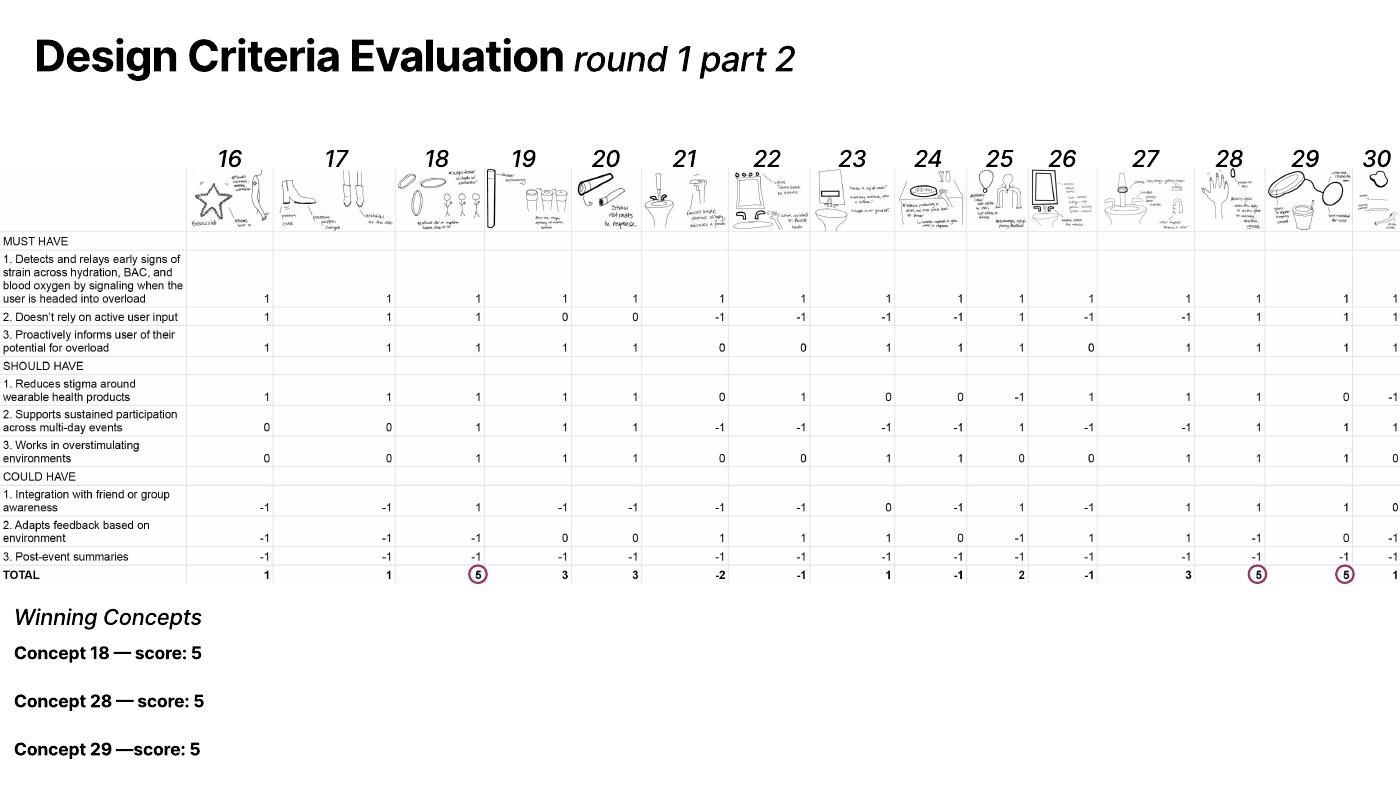
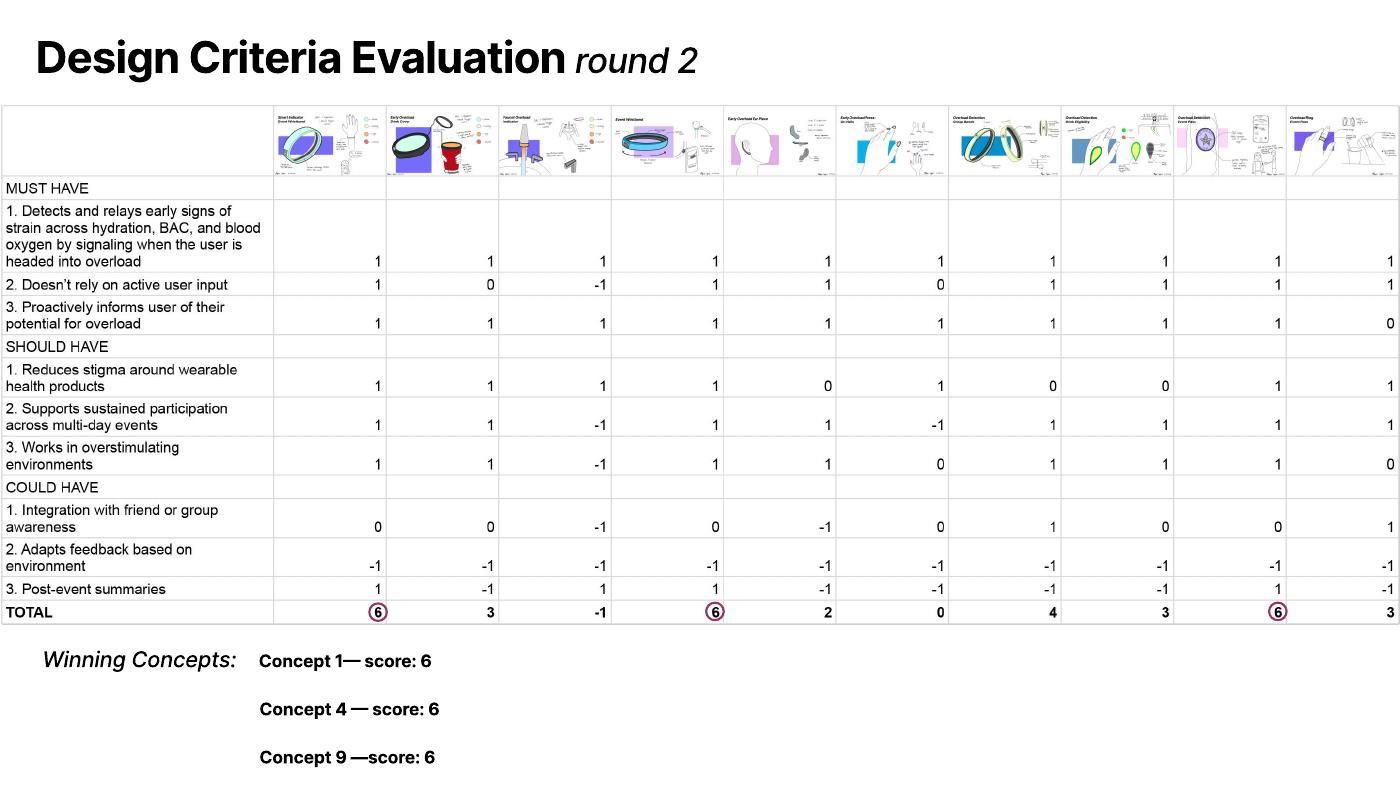
I sketched 30 concepts and scored each against the design criteria: +1 if it meets a criterion, 0 if it’s neutral and −1 if it works against it.
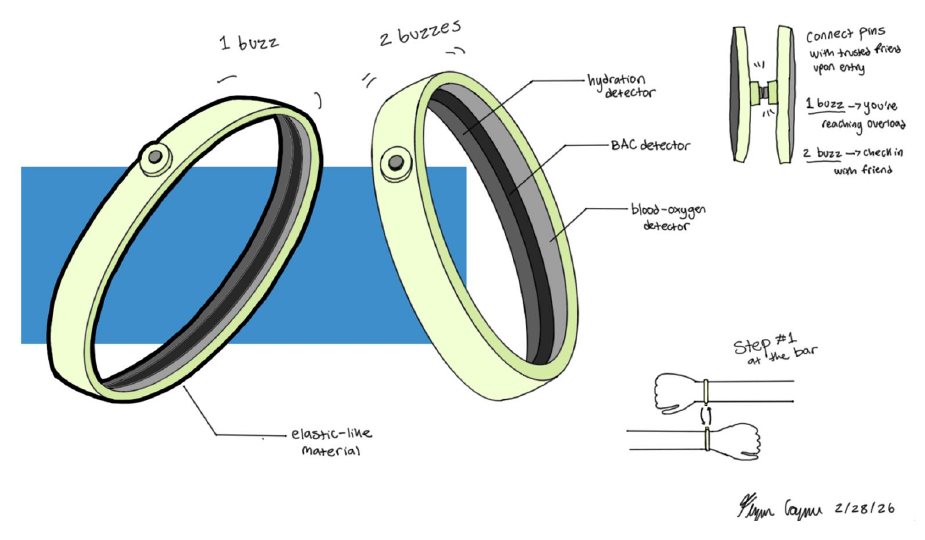
Elastic bands with hydration, BAC and blood oxygen sensors. Friends pair their pins on entry: one buzz means you’re reaching overload, two buzzes means check on your friend.
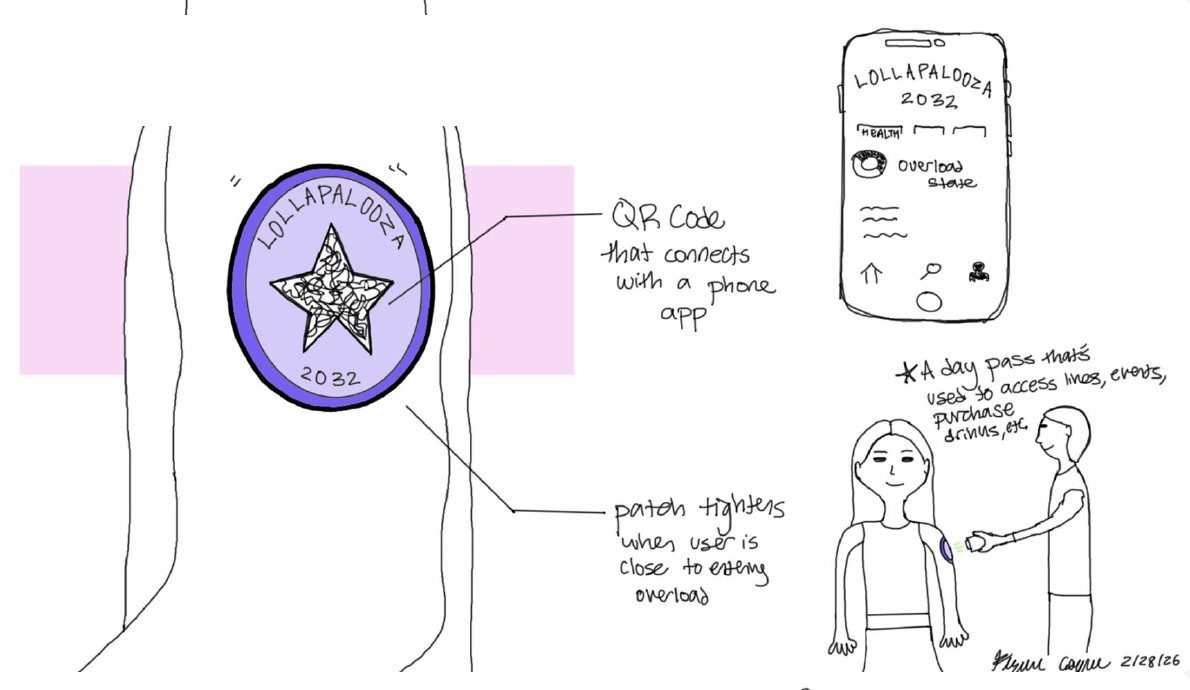
An event patch that doubles as a day pass for lines, entry and drinks. Its QR code connects to a phone app, and the patch tightens when you’re close to overload.
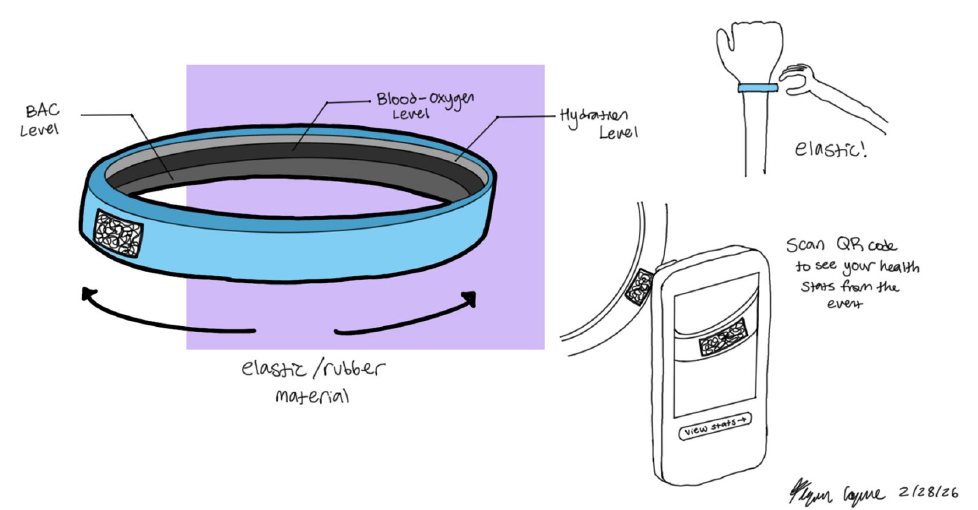
An elastic band that tracks all three levels. Scan its QR code to see your health stats from the event.
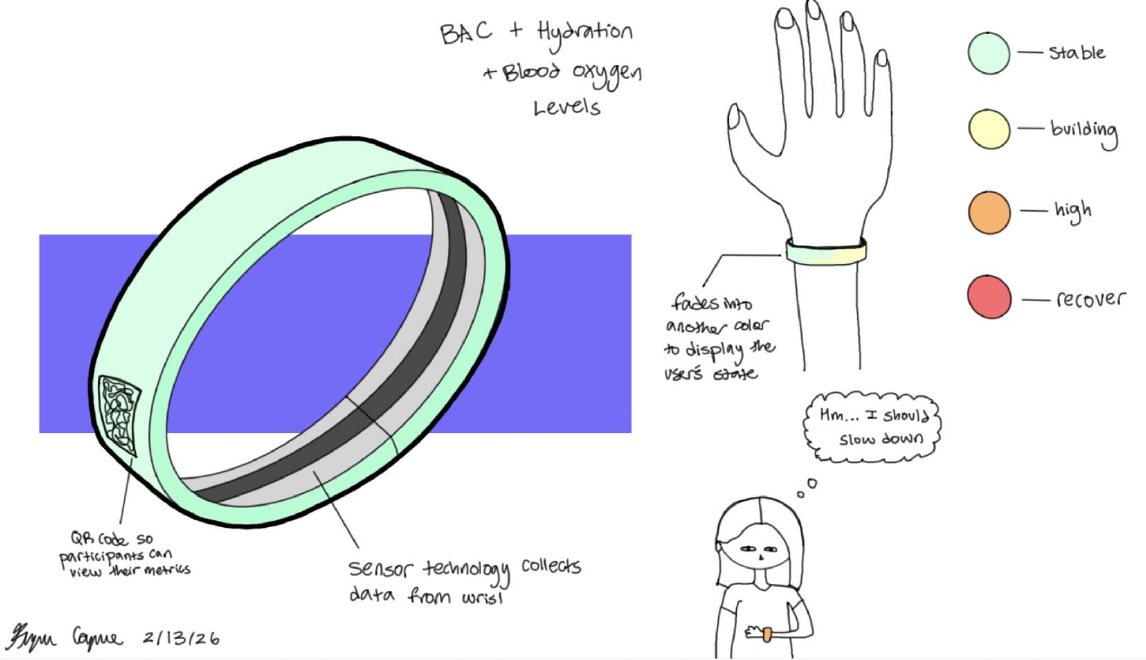
Fades between colors to show your state: green for stable, yellow for building, orange for high and red for recover.
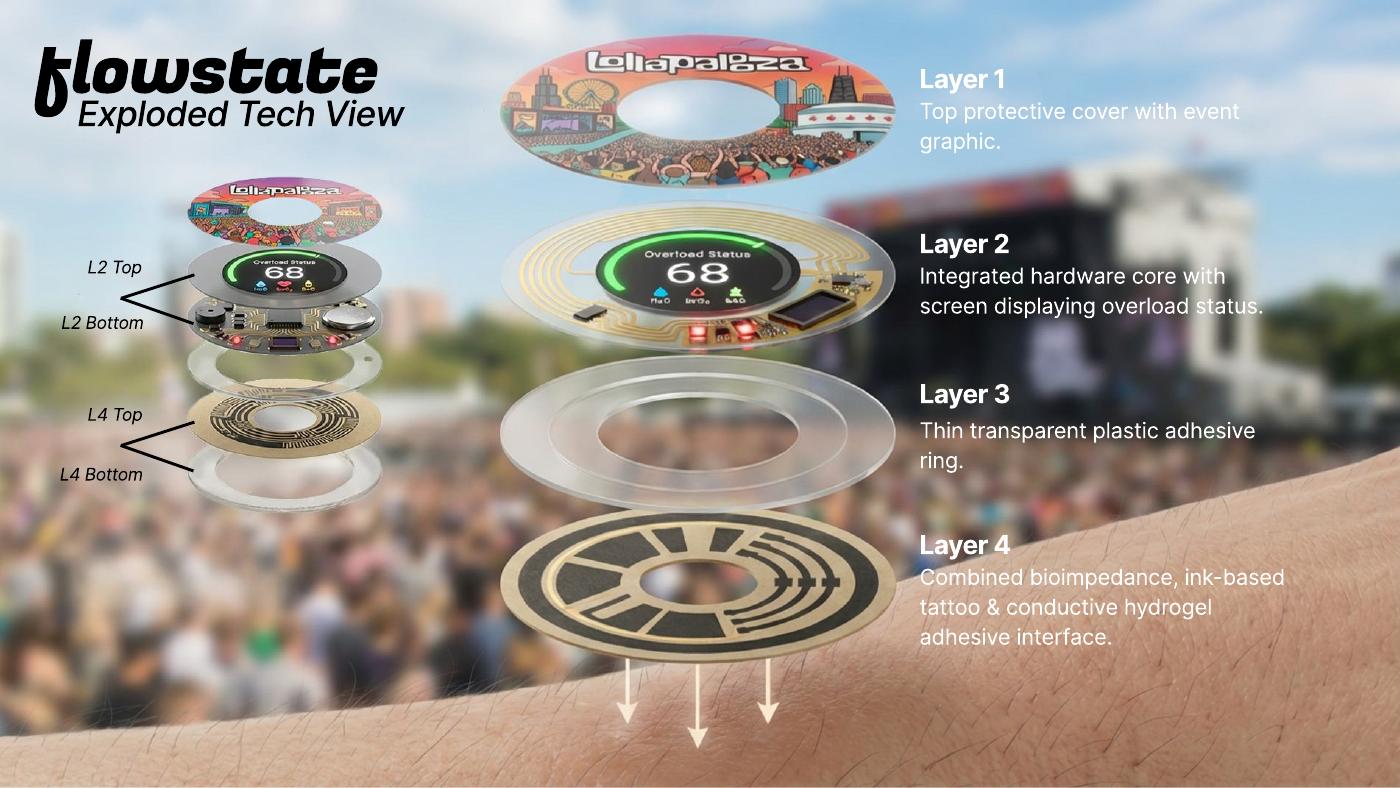
Flowstate layers three emerging technologies so the sticker can read all three signals without the wearer doing anything.
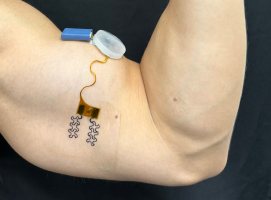
Reads how much water your tissue holds using a current too small to feel. Most accurate once it learns your baseline.
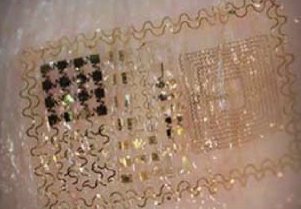
Circuits printed straight onto skin, thin enough to forget you’re wearing them.
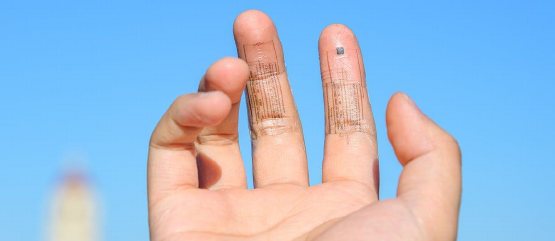
A stretchy electronic layer that moves with your body and can sense all three signals at once.
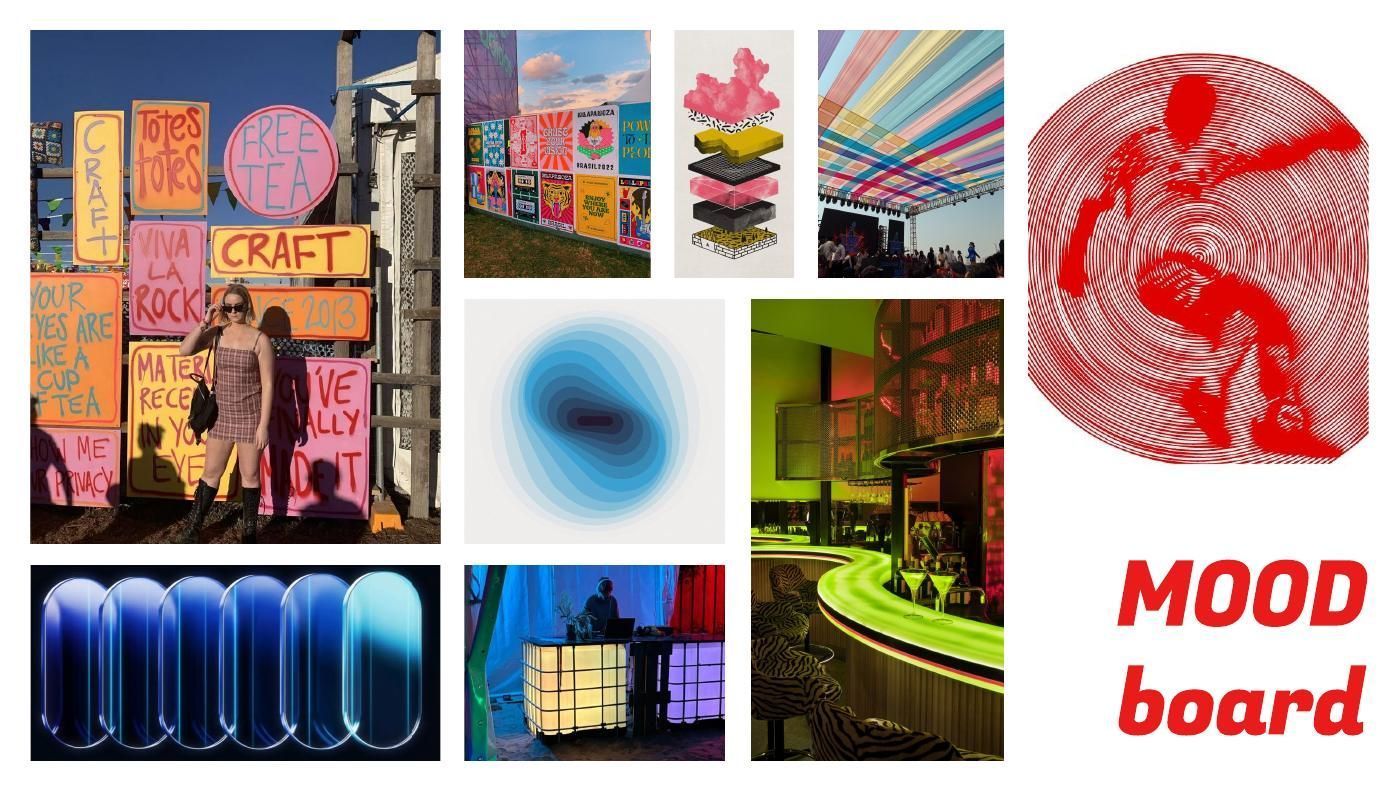
The visual direction drew on festival craft signs and posters, layered illustration, colored canopies, blue gradients, glowing glass pills, neon bars and lit DJ booths: vibrant and handmade, with a glow that reads in the dark.
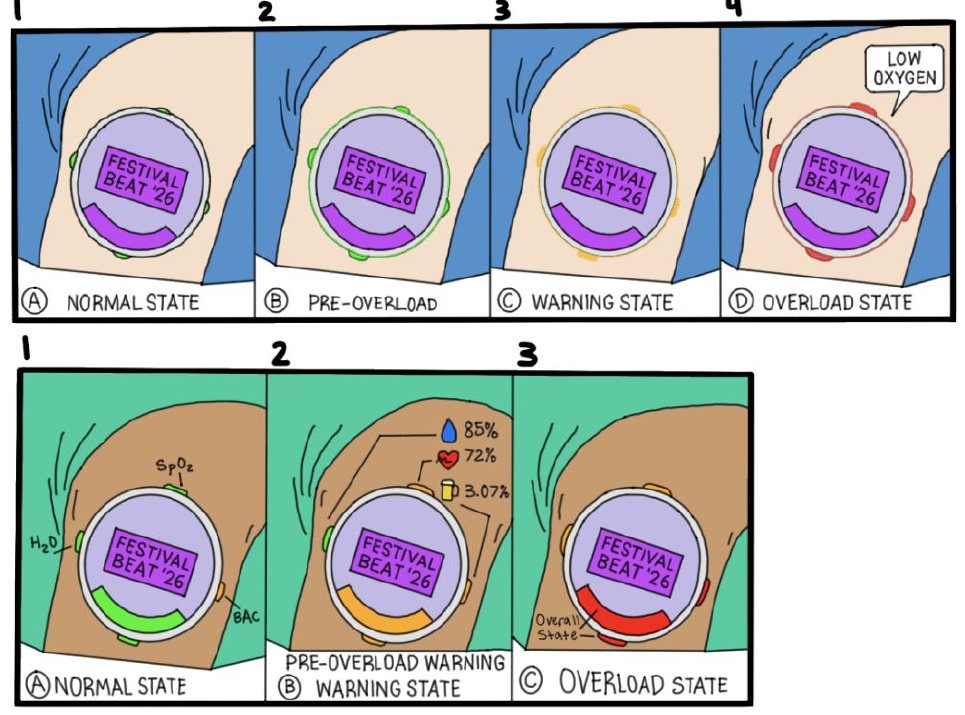
For the sticker patch, I explored how it would show each state, from normal to overload, with hydration, SpO₂ and BAC indicators around the edge.
User testing
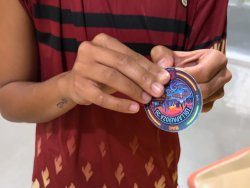
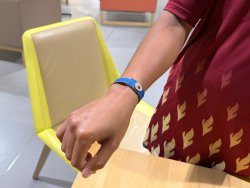
Pro “Fun, aesthetic, comfortable, and versatile!”
Con “Hard to peel off the backing.”
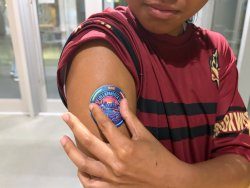
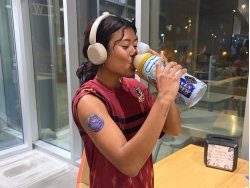
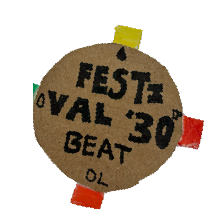
Pro “Very easy to read. The labels are helpful.”
Con “Bulky and stiff.”
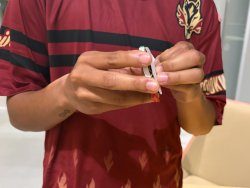
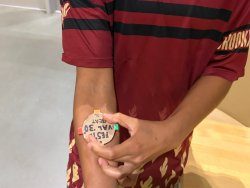
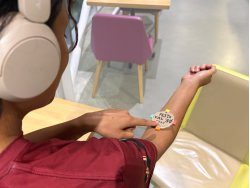
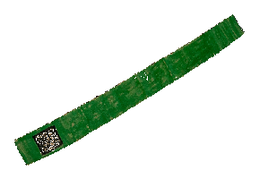
Pro “Easy to put on. The QR code is nice to see my health stats in another way.”
Con “Just the band changing colors isn’t enough to notify the person.”
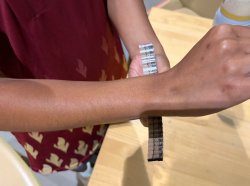
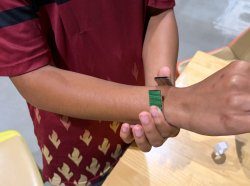
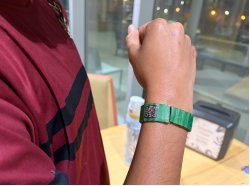
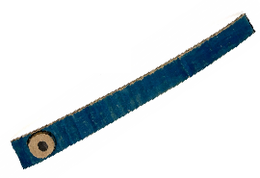
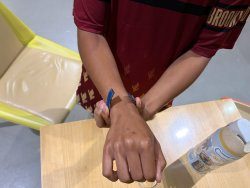
Pro “So good to have the band notify a friend. It helps to keep each other accountable.”
Con “How accurately will the technology track my stats if the band shifts?”
What I took forward
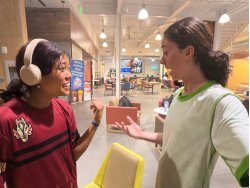
The sticker was the most comfortable and fun to wear, a band that moves can’t measure reliably, and color alone isn’t enough, so the final design pairs a clear number on the sticker with gentle haptic taps and a phone view for detail.
Final design
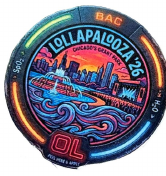
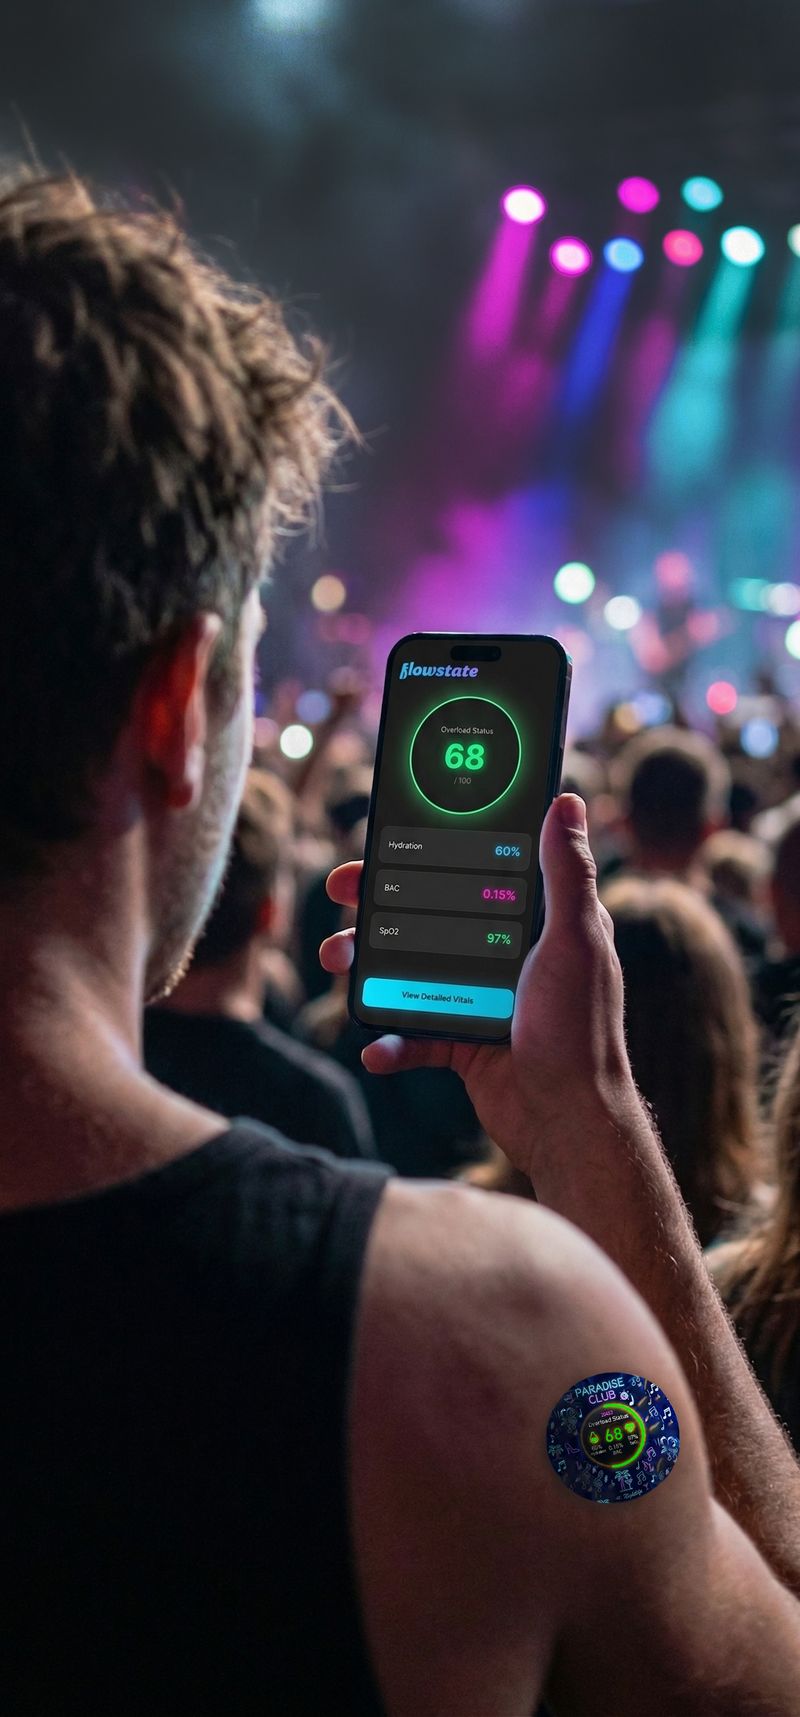
Applied at the door, Flowstate is a smart, custom-printed sticker that monitors hydration, BAC and oxygen levels in real time. Instead of guessing your limits, it gives you gentle haptic taps when it’s time for water, and lets you scan for a full breakdown of your stats.

Because each sticker carries the event’s artwork, it feels like a souvenir, not a medical device, which reduces the stigma of wearing health tech. It’s worn on the chest or upper arm.
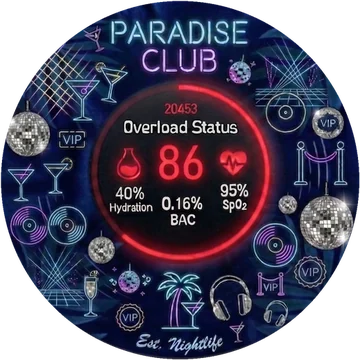 ClubParadise Club
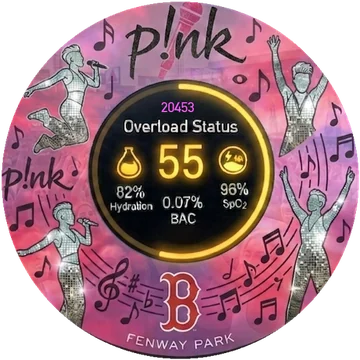 ConcertP!nk · Fenway Park
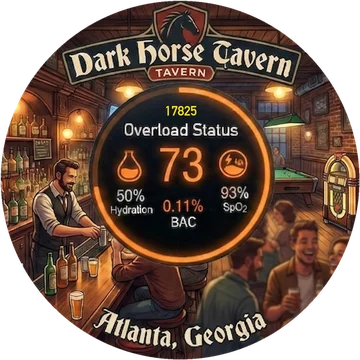 BarDark Horse Tavern
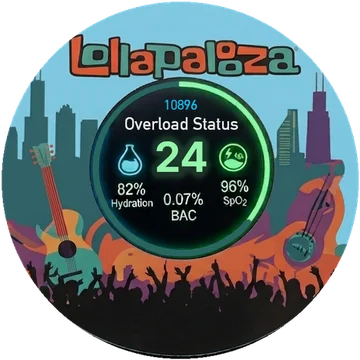 FestivalLollapalooza
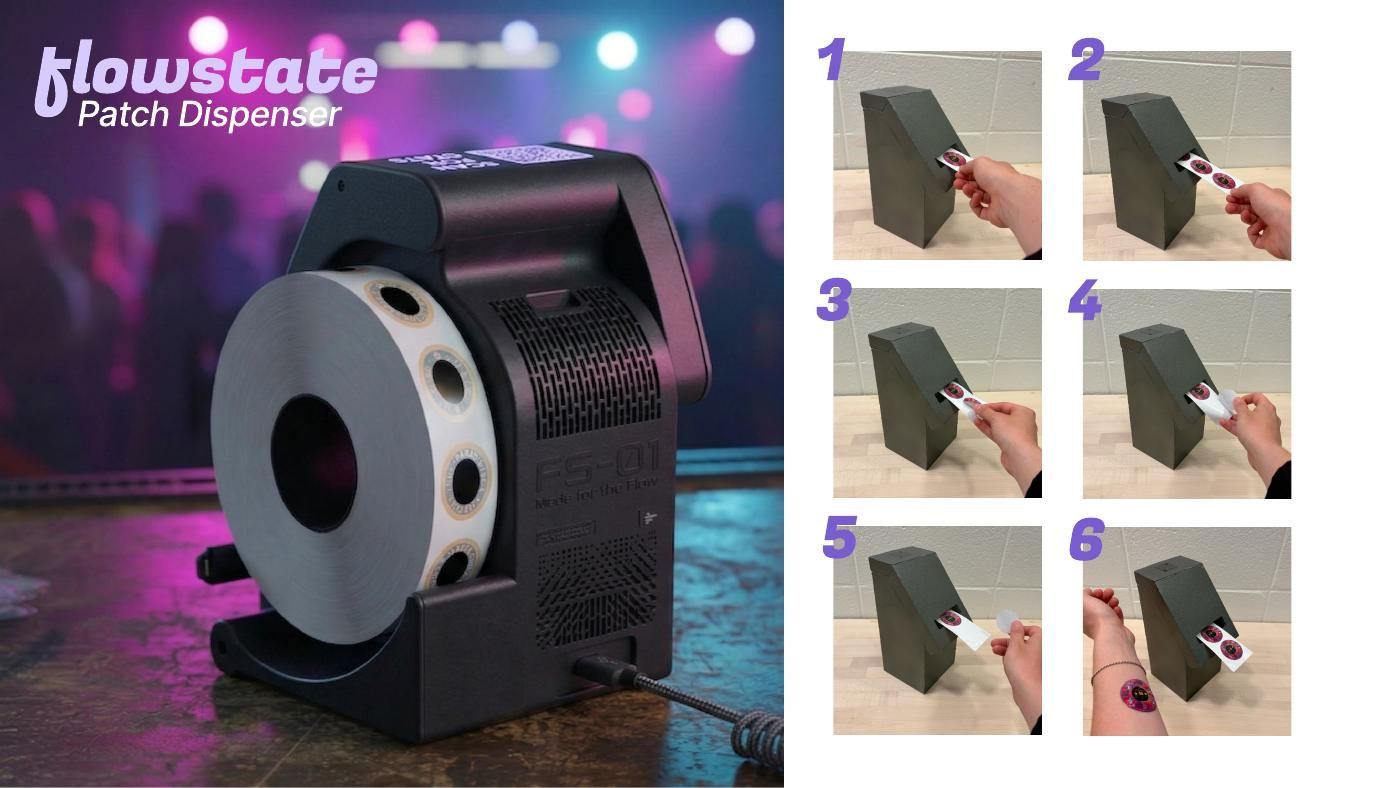
At the door, staff use the dispenser to hand each guest an event-branded sticker, which they can then pair with their phone by scanning its QR code to see their live vitals.
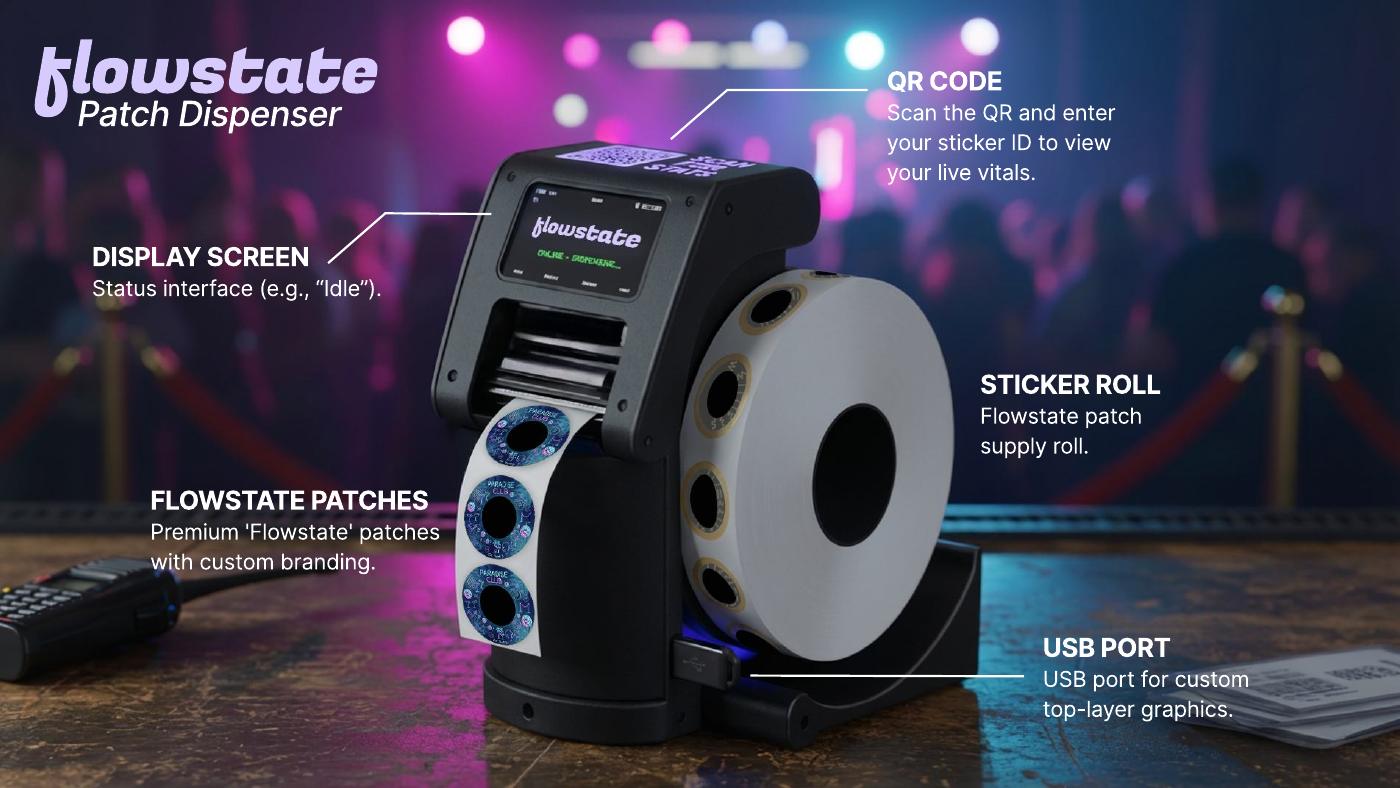
A mobile web page, opened from the dispenser’s QR code, with real-time vitals and actionable next steps.
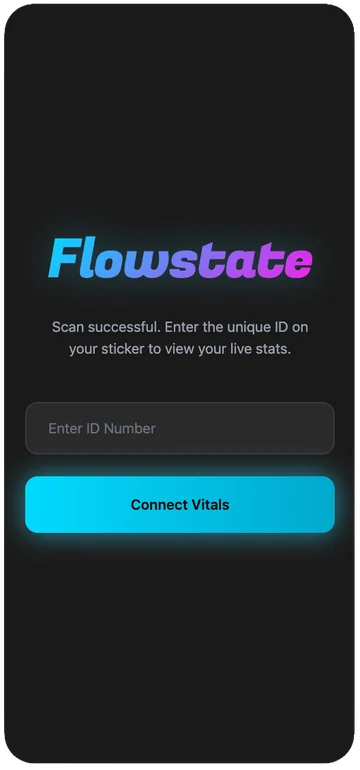
Enter your sticker’s unique ID to connect your vitals.
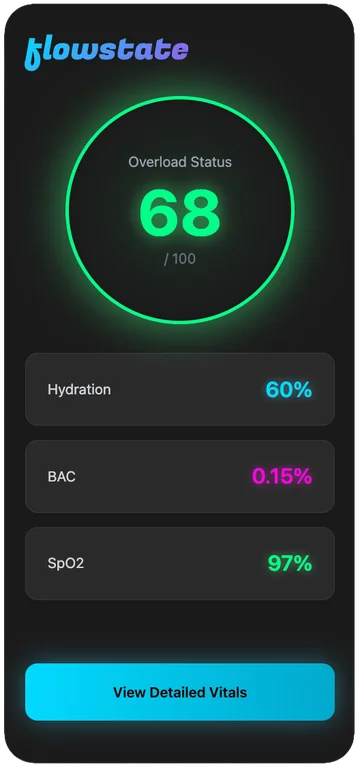
An overload status out of 100, with hydration, BAC and SpO₂ at a glance.
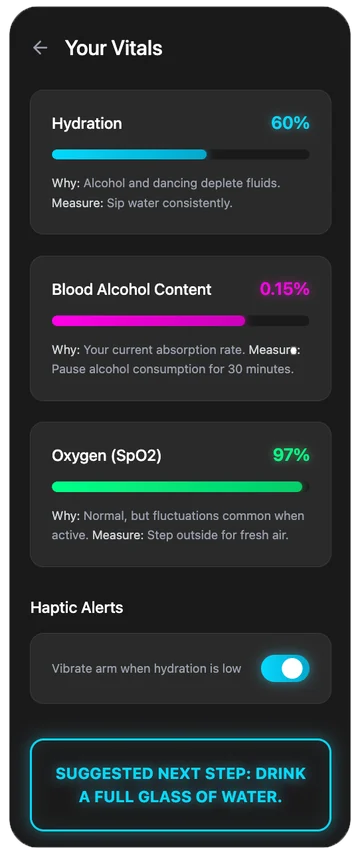
What each vital means, haptic alerts and one next step.
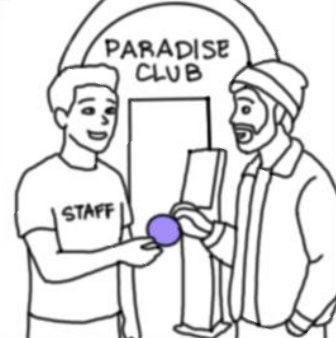
Staff introduce Flowstate at the door, so it feels like part of the night, not a medical check.
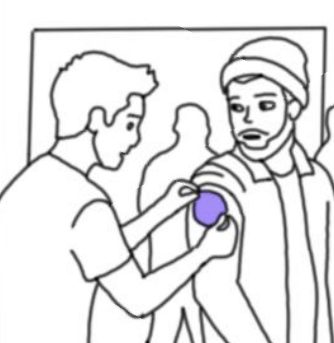
One sticker, applied in seconds. No app, account or setup.
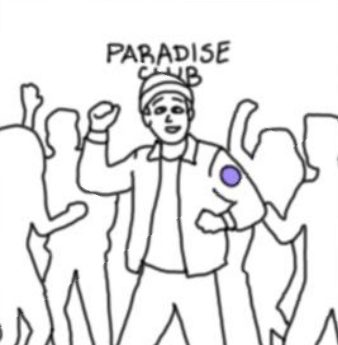
Monitoring runs quietly in the background while he enjoys the night.
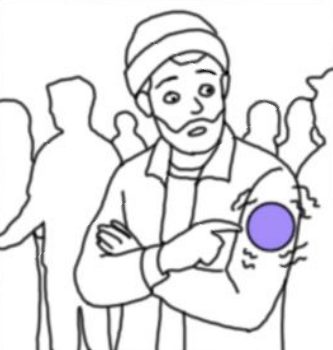
A gentle tap signals it’s time to slow down, before he feels it himself.
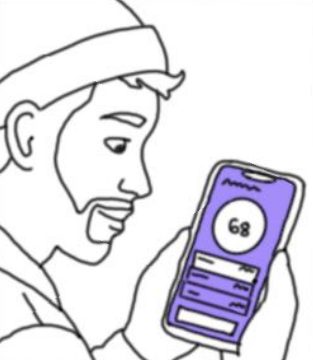
A quick scan shows his overload score and what’s driving it.
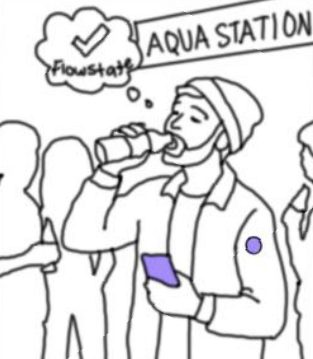
He drinks water and gets back to the night, no crash.
Outcome
1st Place · $2,000
Recognizes outstanding undergraduate work in humanitarian design, judged on impact, innovation, and the quality of design execution and presentation.
3rd Place · $2,000
A juried, two-stage award for industrial design inspired by Bauhaus principles. The 2026 theme was “Creative Recreation.”
View the 2026 SID Awards (opens in a new tab)
Case study · Fall 2024
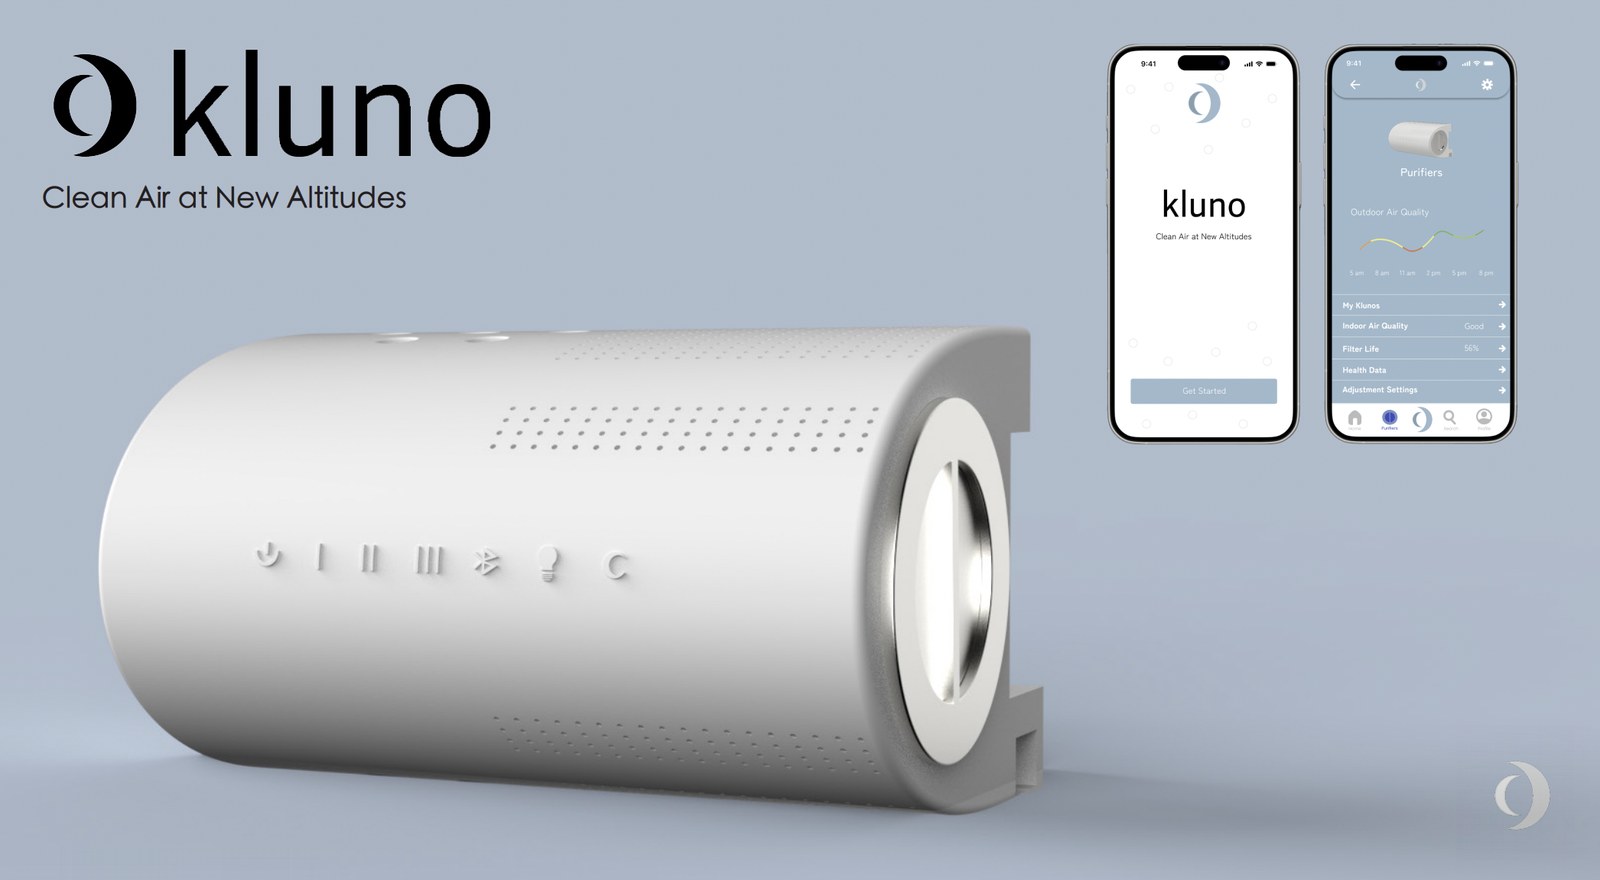
Clean air at new altitudes.
A smart air purifier that clips onto the rod of your window blinds, so it stays off the floor and releases clean air straight into the room, with an app to control it from anywhere.
The problem
Indoor air carries more than we notice. Dust builds up from food particles, pollen, fabric fibers, pet dander and insect parts, and outdoor pollutants get in through open doors, windows, vents and cracks in the walls. Curtains and blinds make it worse: they hold dust like a rug does, and every slat of a horizontal blind becomes a dust hotspot.
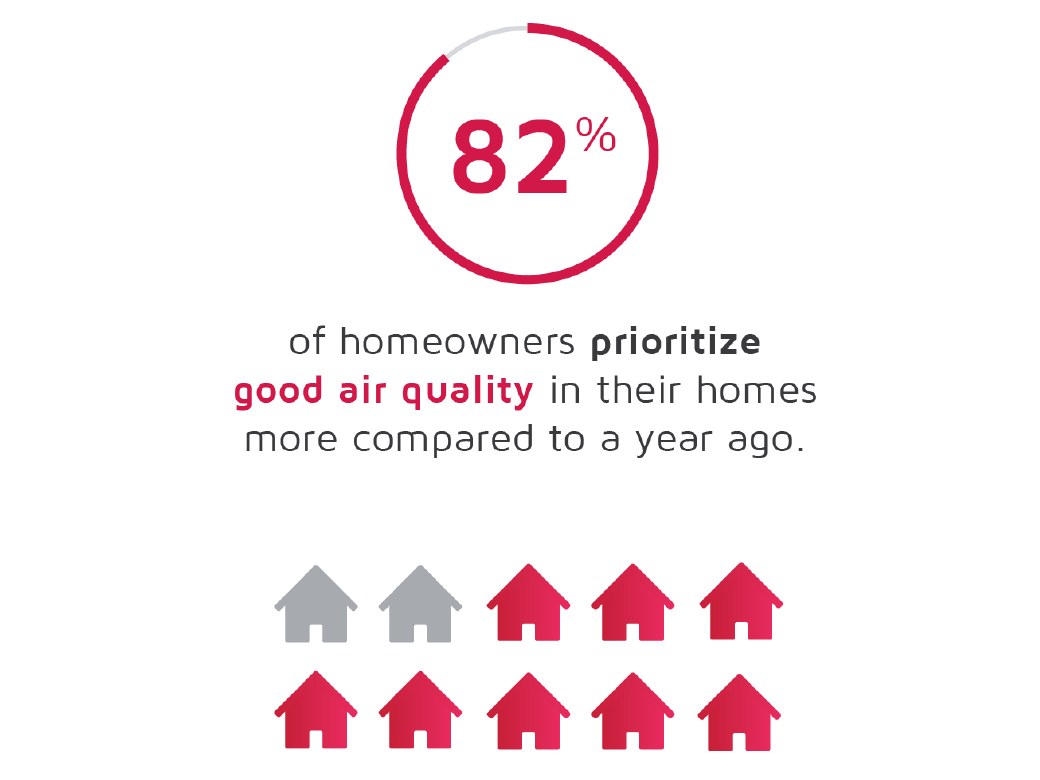
People are paying more attention to the air they breathe at home, and they expect cleaning products to keep up with newer, more advanced technology.
Sources: U.S. EPA, OECD, Grand View Research and Factory Direct Blinds.
Research
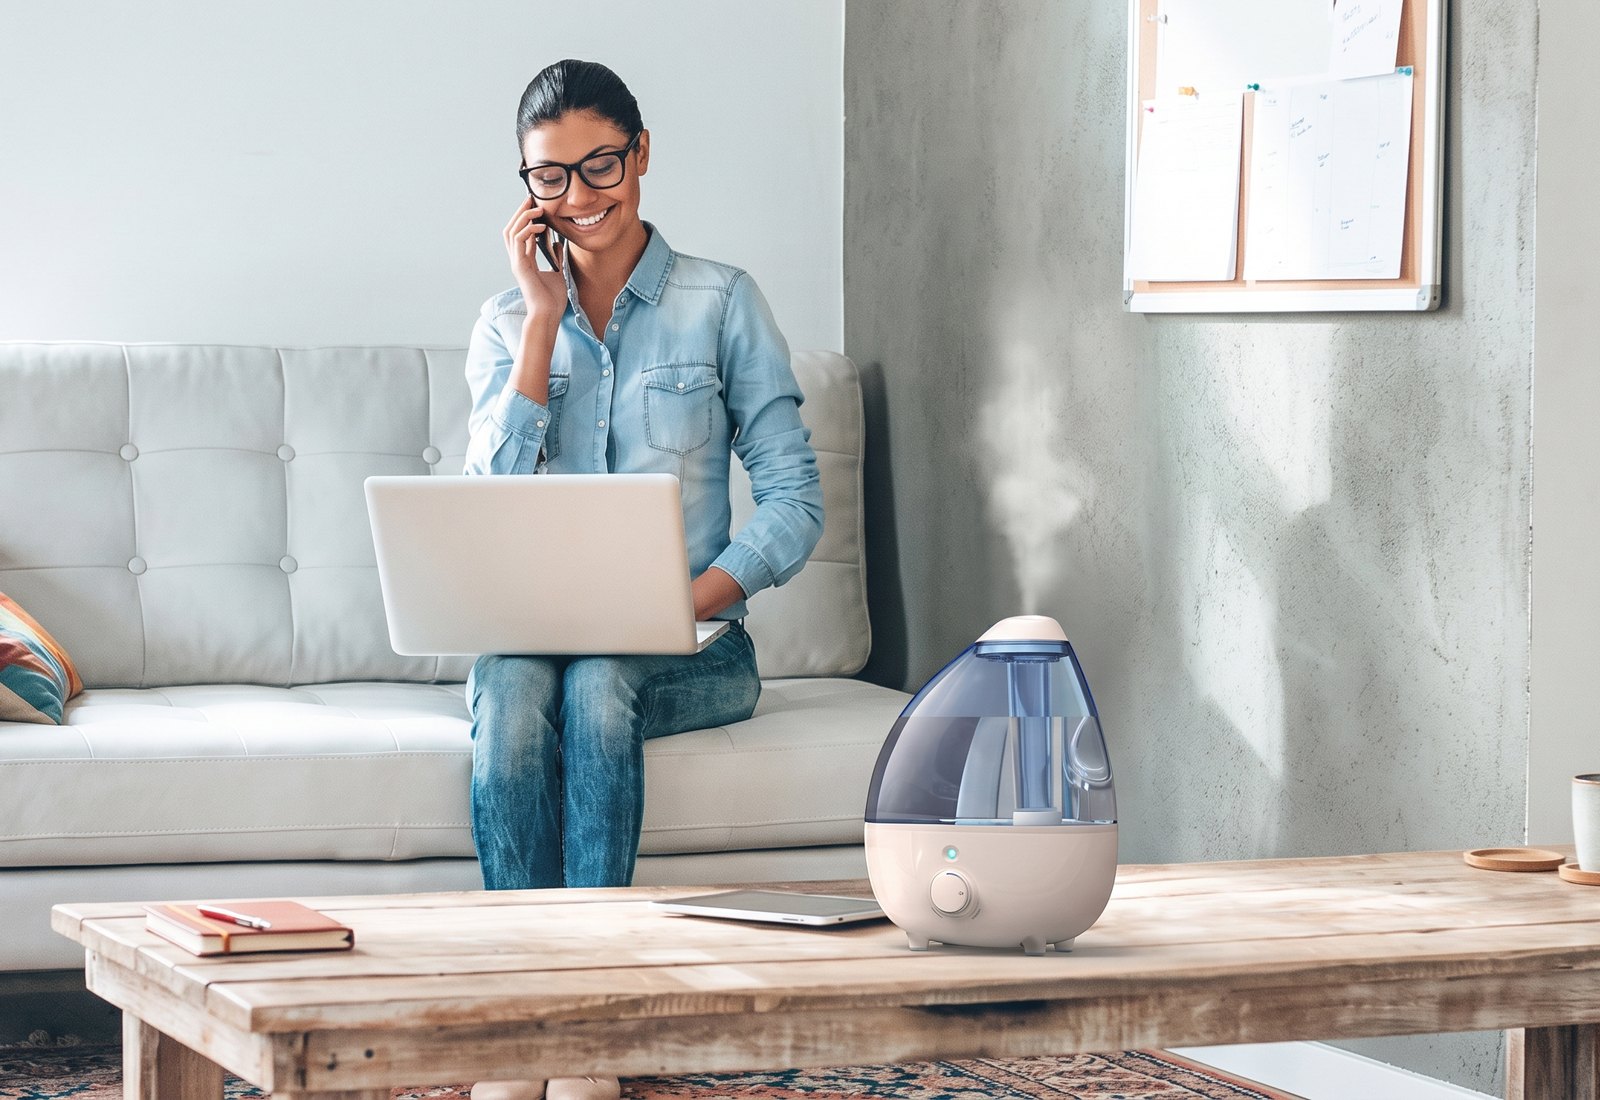
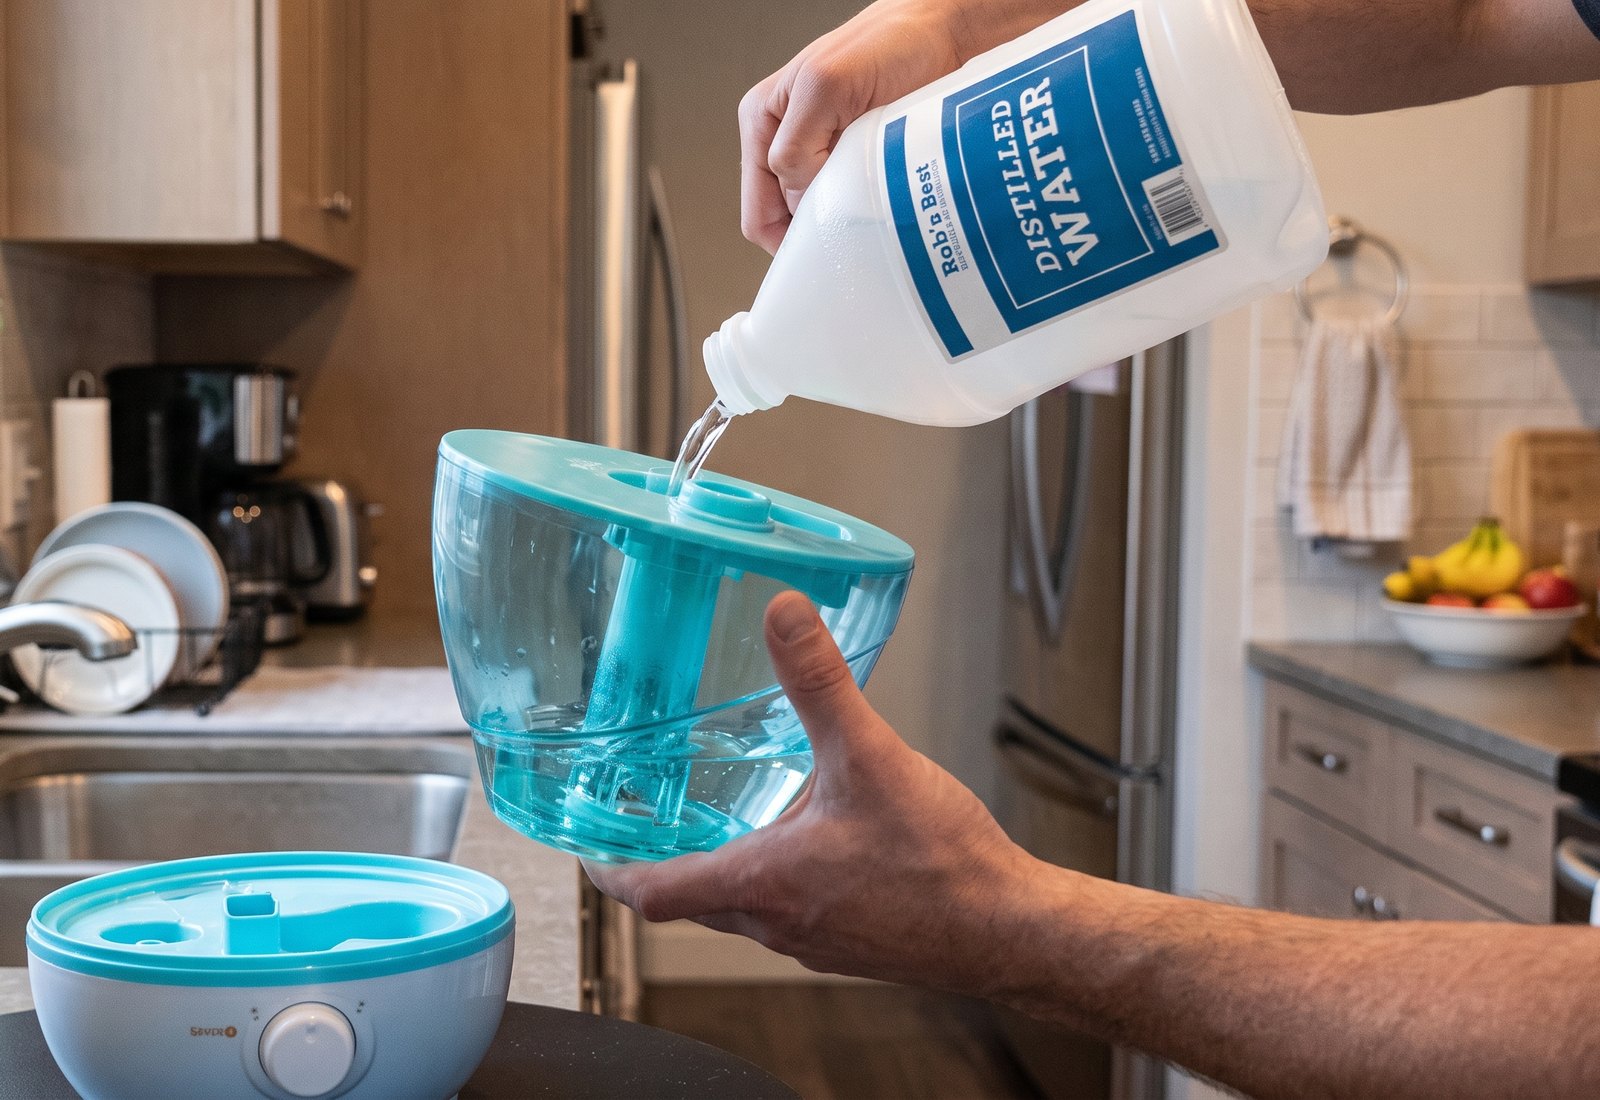
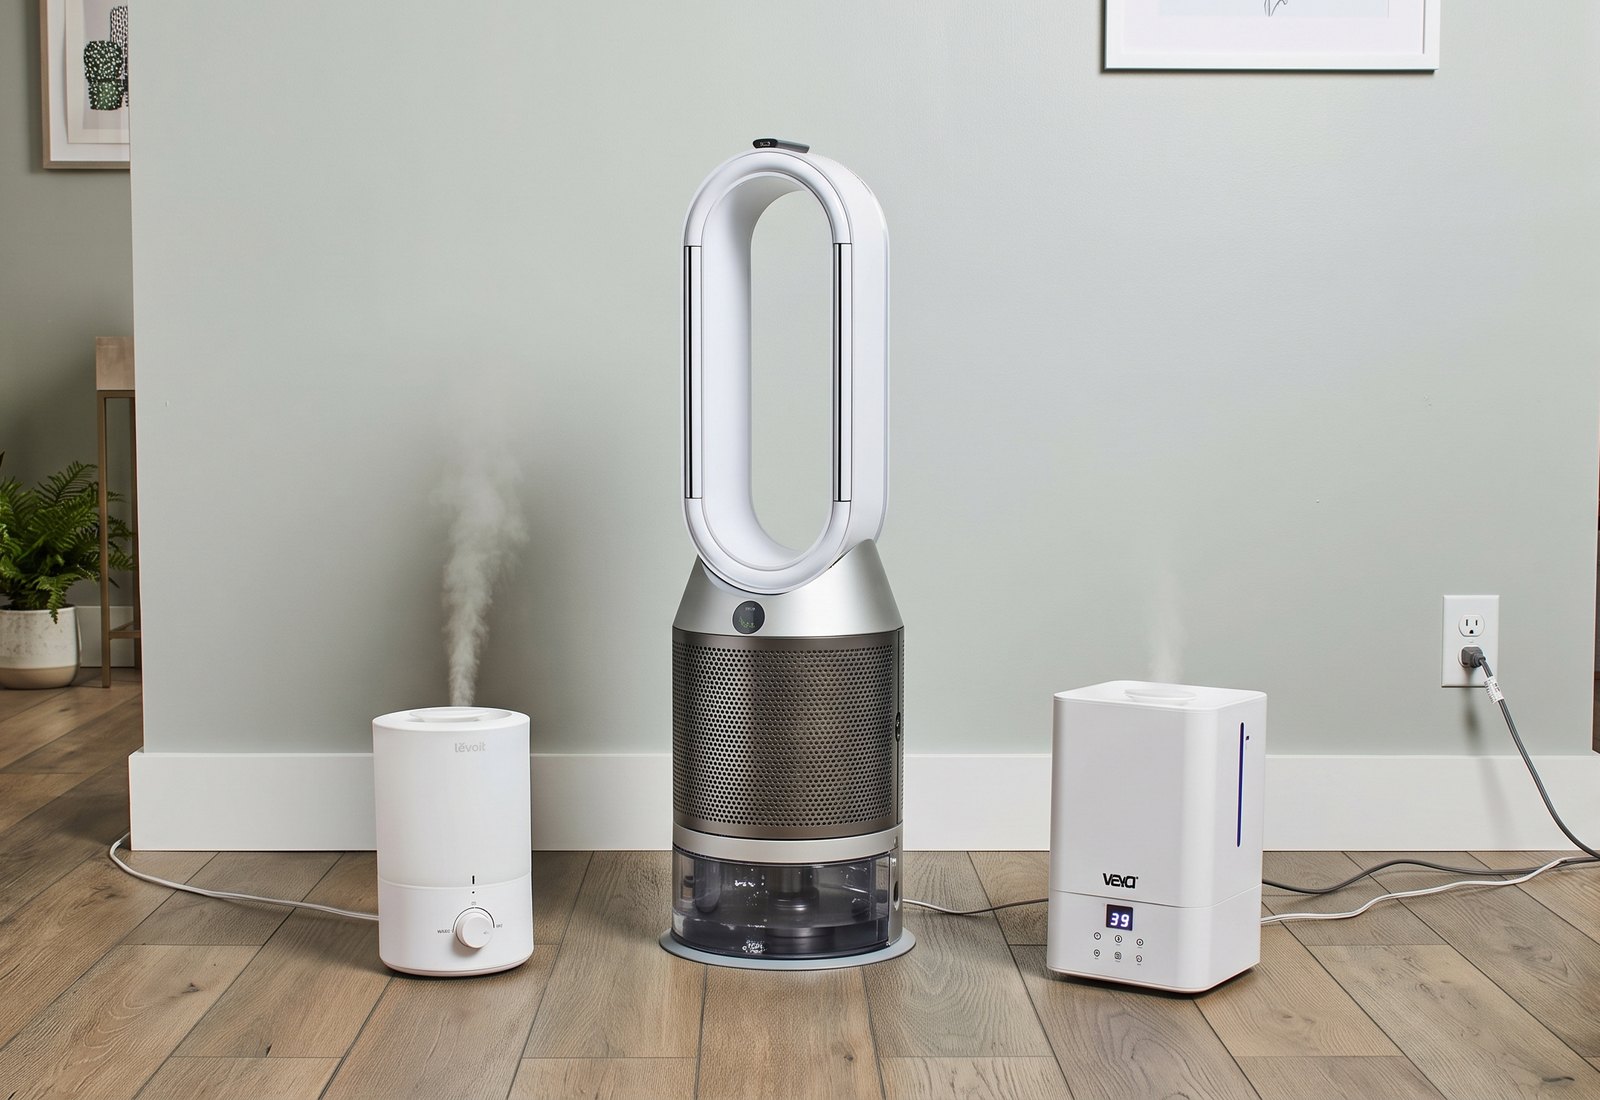
I combined a literature review with in-person observation, watching people set up and use air purifiers and humidifiers in their homes. Two personas came out of that research.

The pet owner
A Levoit air purifier, a Dyson V7 vacuum and a pet hair removal tool.

The student
A Levoit air purifier, a MistAire humidifier and a Dyson V7 vacuum.
Based on my in-person observations of real users, I mapped a night with an air purifier in seven stages. People are happiest once it’s running quietly while they sleep. The low points are at the start and the end: finding a spot for it, plugging it in behind the bed, and reaching back there again to unplug it.
Six observations from my in-person research, and what each one means for the design.
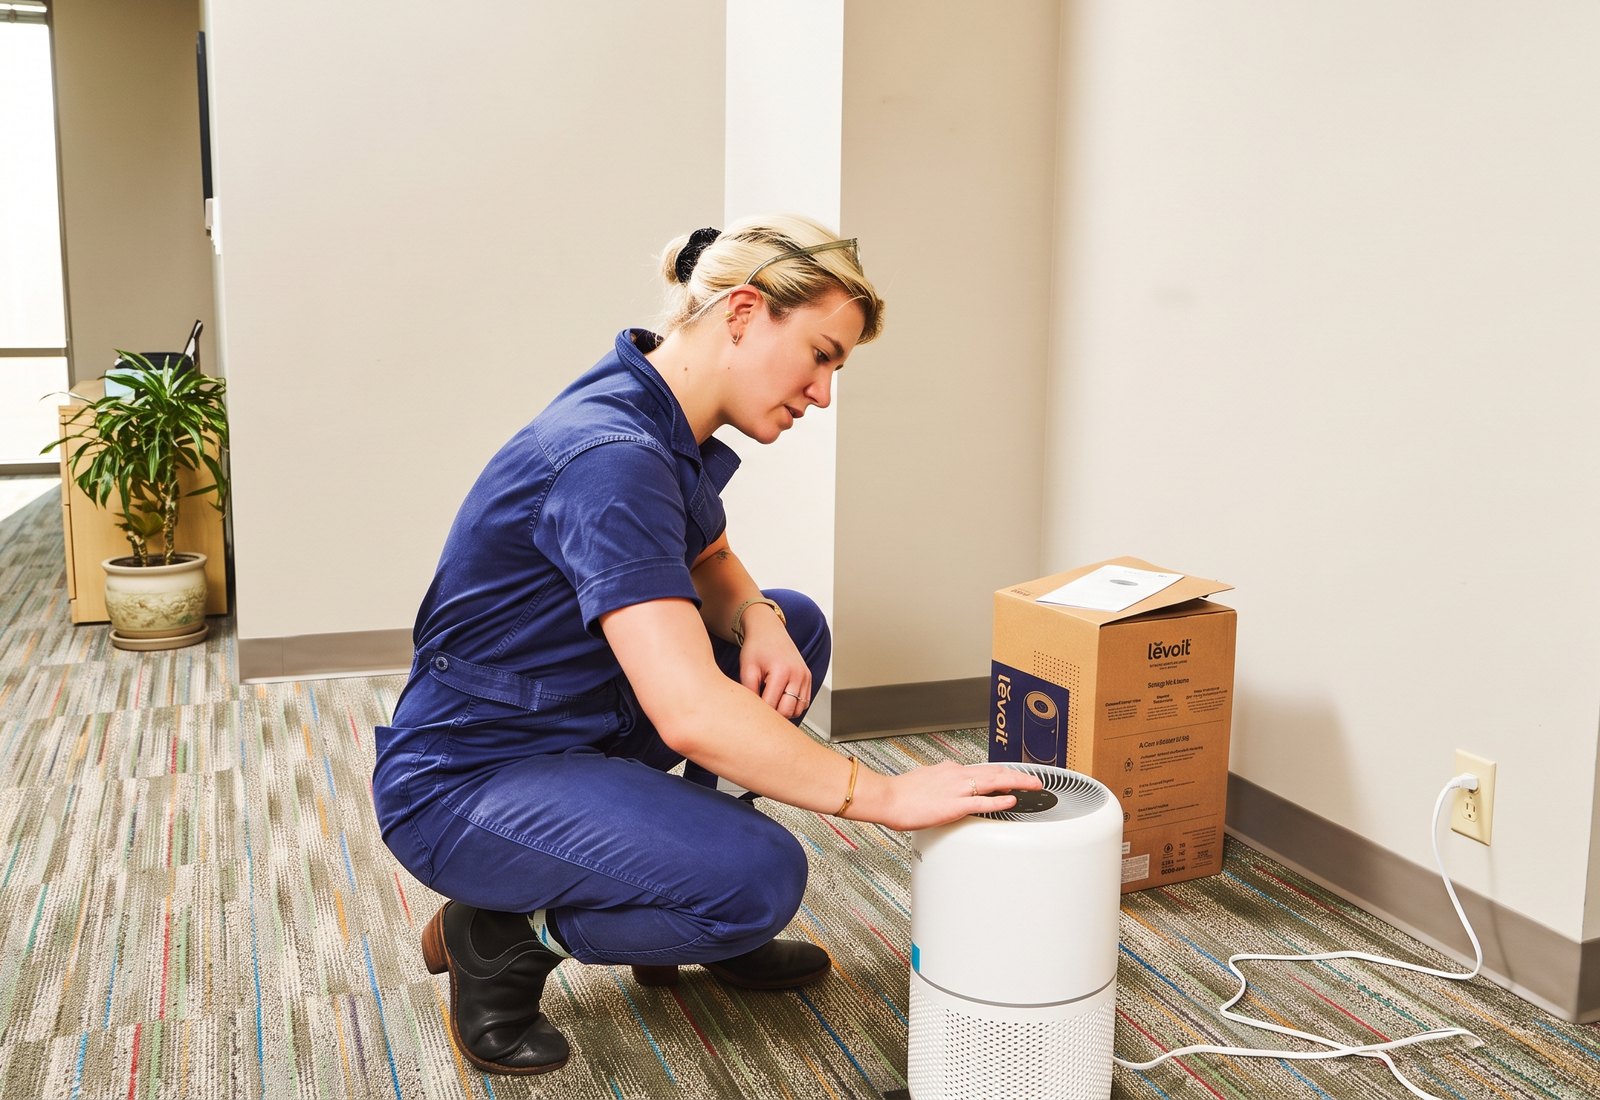
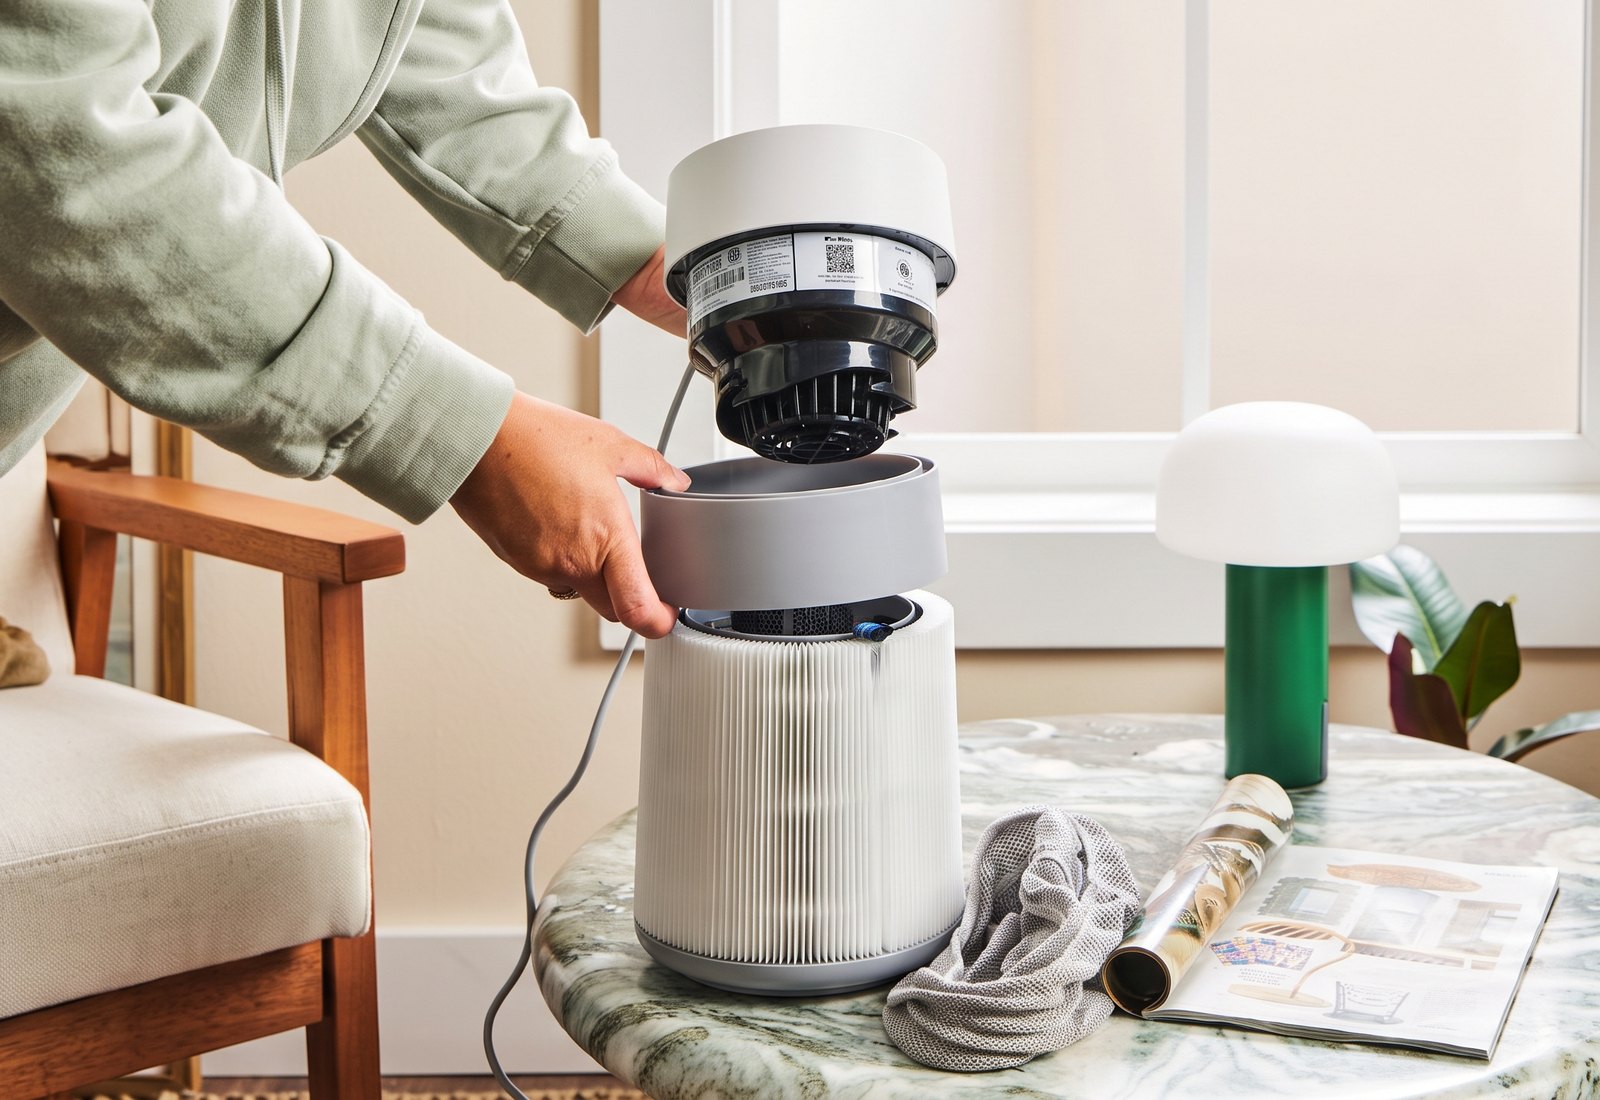
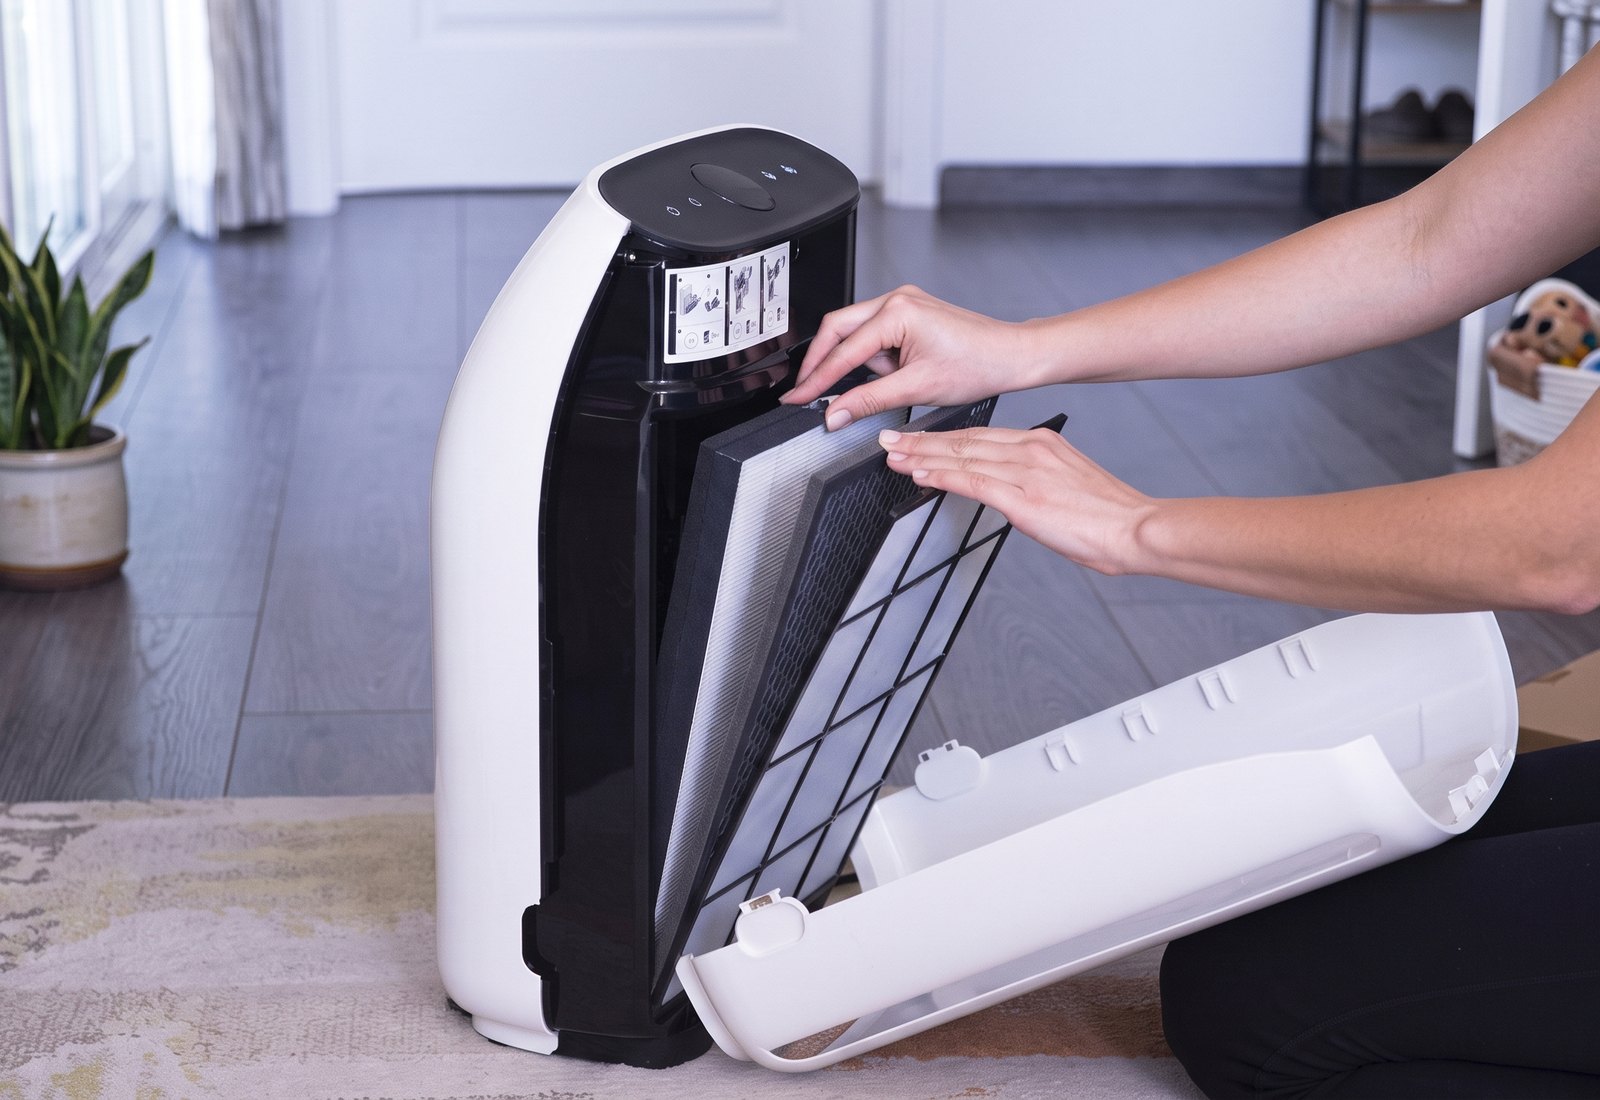
To understand how air purifiers work, I took one apart and studied how air moves through it, where the filter sits and how it gets replaced.
The purifier I took apart: a compact Levoit HEPA model.
Top view: the control panel, with clean air released through the vents around it.
Flipped over: the base twists to open.
With the cap off, the filter slides out of the body.
The HEPA filter, lined with a pre-filter to collect dust and airborne particles.
Taken apart: main body, filter and base cap.
Define

Design objective
To design an air purification system for allergy-prone people that uses advanced filtration to clear the smallest, most stubborn pollutants, leaving them healthier and their space cleaner.
I mapped more than 30 purifiers and humidifiers. The ones that clean well have no set place, so they end up on the floor.
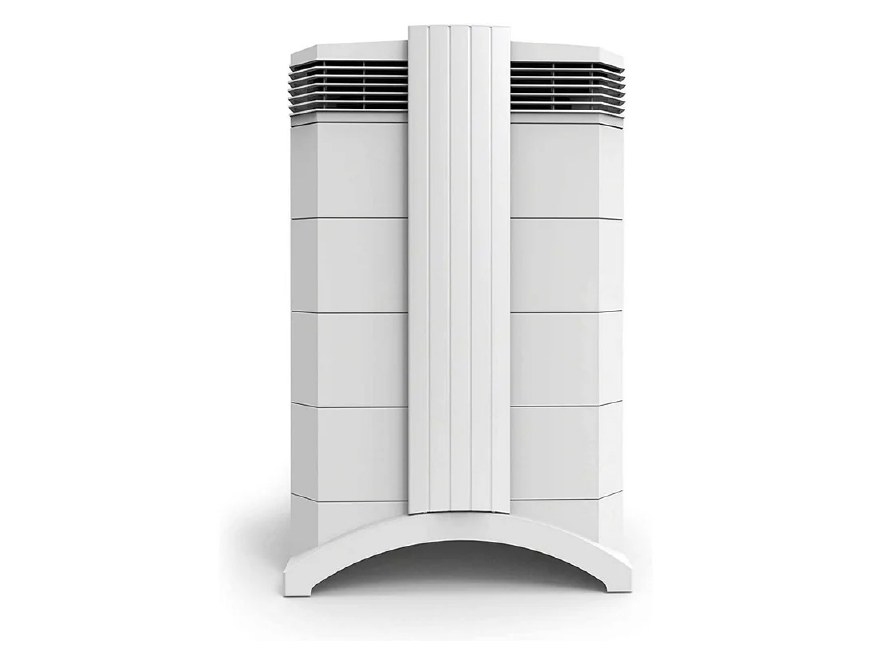
I compared emerging filtration technologies and market trends. Kluno uses layered filtration: a pre-filter that catches larger dust and hair, a HEPA filter for fine particles and an activated carbon filter for odors.
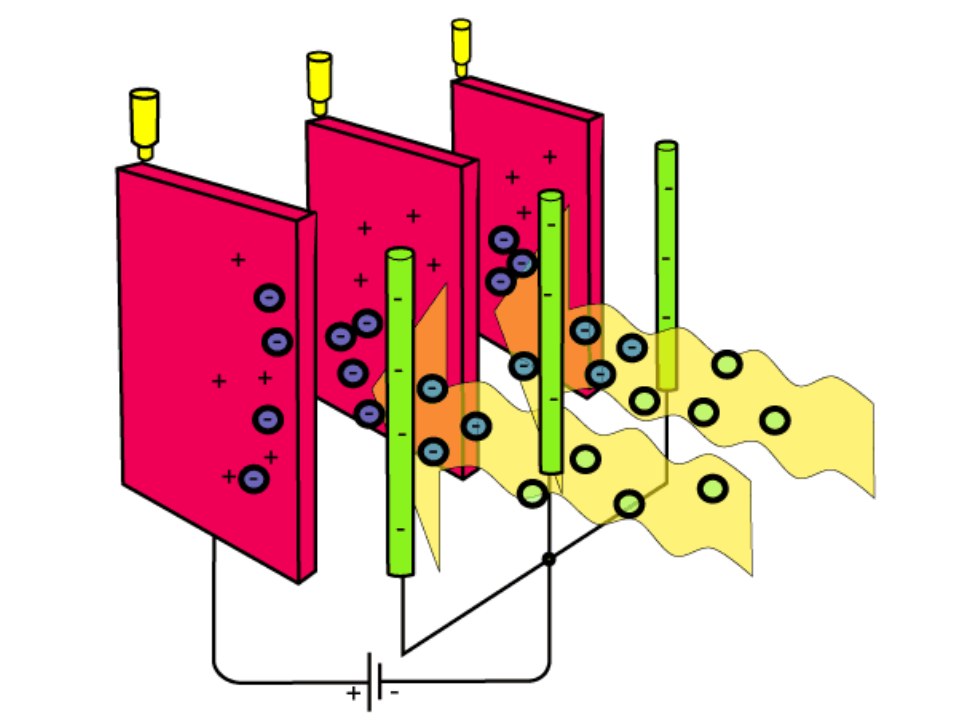
Use an electric charge to pull tiny particles out of the air. They’re very good at catching the smallest particles, so demand for them is high.
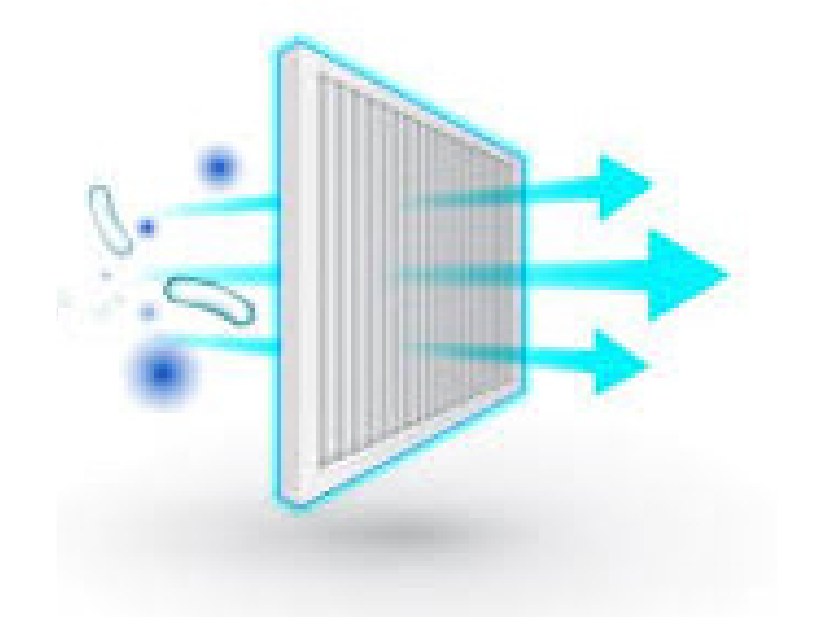
A type of filtration that can trap particles as small as 0.003 microns, which greatly reduces exposure to bacteria and viruses.
Ionic filters don’t need to be changed often, and their share of the cleaning device market is expected to grow quickly in the coming years.
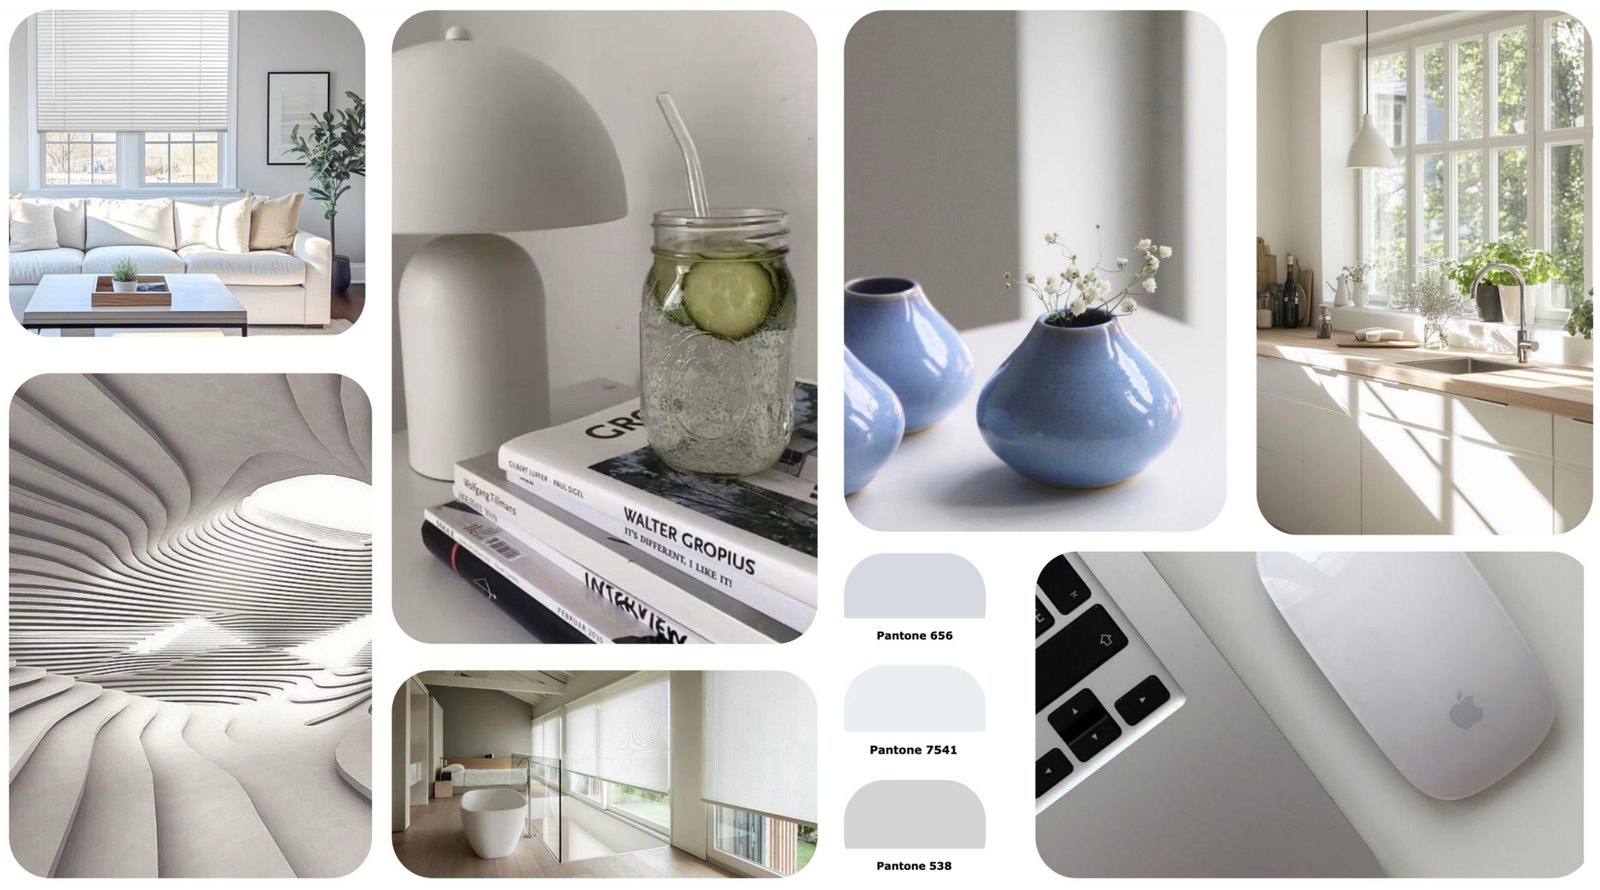
Soft whites, warm grays and a touch of powder blue, with clean, rounded forms that disappear into a bright room.
Ideation
I sketched 30 concepts across purifiers, humidifiers, vacuums and smart home ideas, then refined ten of them in color. The strongest put the purifier on the window: it gets a set place off the floor and can clean the blinds, one of the dustiest spots in the room.
Three window concepts, each exploring a different way to hang the purifier and change its filters.
Smart window hanging air purification system with blinds
Smart air purification system with blinds
Smart tension air purification system with blinds
My sketch models showed me the scale of the purifier and how it would hang on a window.
What I learned from the models went into three more refined concepts, with the purifier hanging from the trim or a support bar.
Lift and replace HEPA air purification blinds
High-tech air purification blinds
Trim-hanging air purification blinds
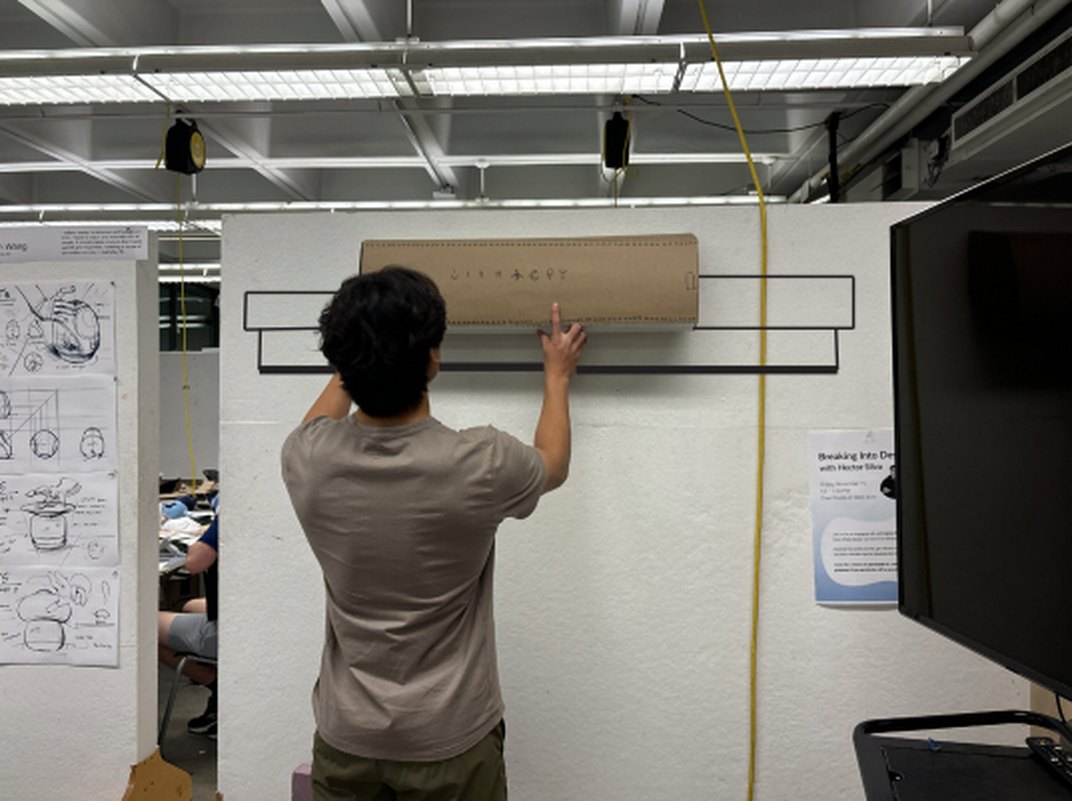
I built a full-size model out of chipboard and foam core from a starter orthographic drawing, adjusting the design as I crafted it.
User testing
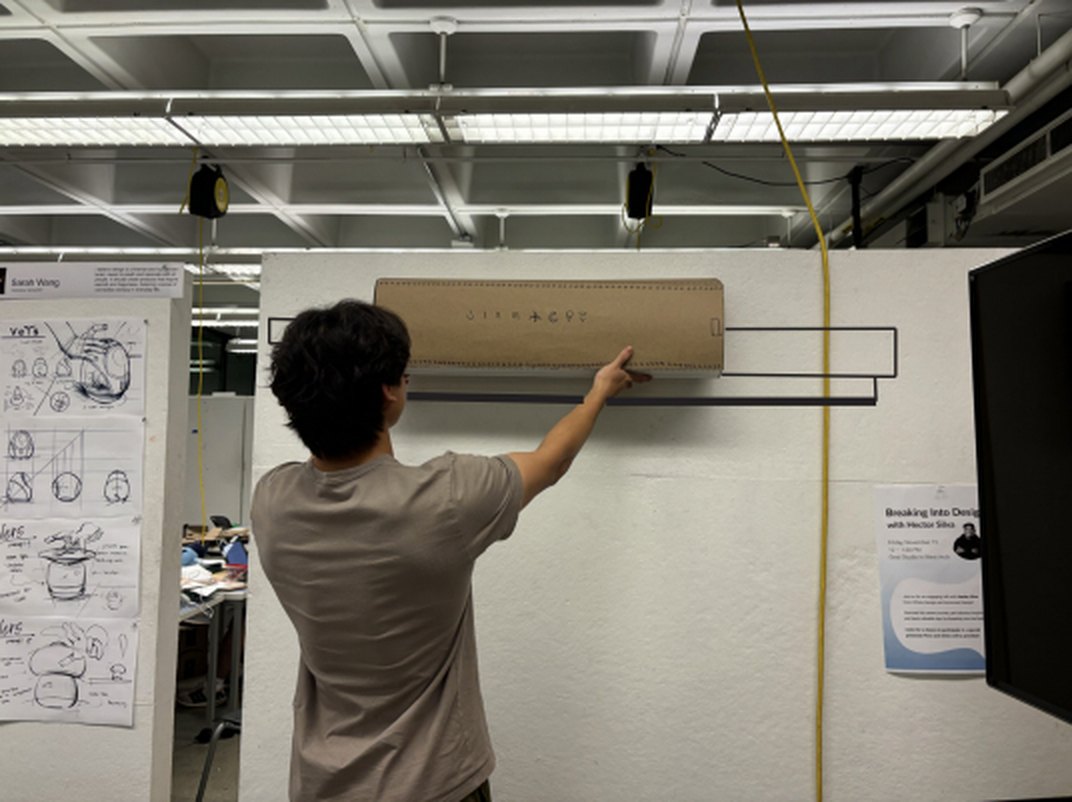
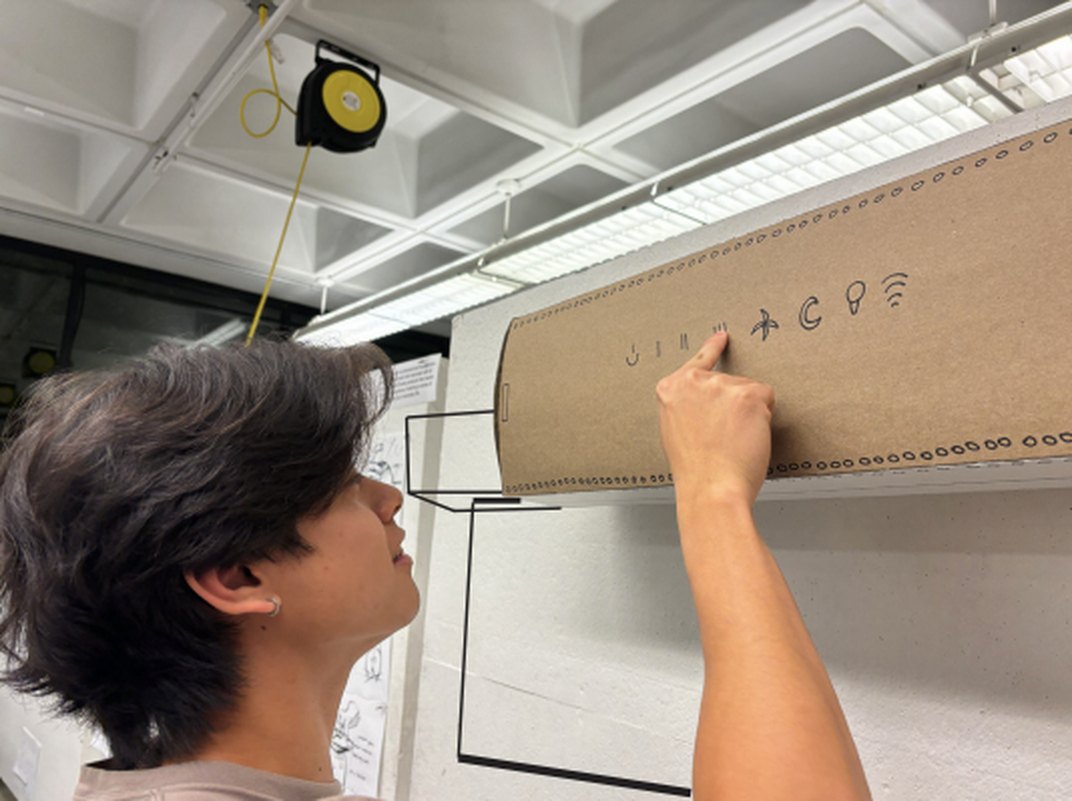
In critique, a classmate tested the 1:1 chipboard model on a wall-mounted window frame. Watching him use it showed me what worked and what didn’t.
1
2
3
Using the testing feedback, I made the purifier smaller and moved the HEPA filter to the side so it’s easy to remove and replace.
What I changed
After this revised concept, I talked with my professor, and we landed on fully separating the blinds from the product to focus only on the air purifier attachment. Instead of replacing your blinds, Kluno now clips onto the rod of the blinds you already have and sits on the window trim. It’s smaller and lighter, and can work with a variety of blinds.
Final design
Kluno is a smart air purifier that clips onto the rod of the blinds you already have and rests on the window trim. It clears floor space, releases clean air straight into the room and keeps the blinds below it free of dust.

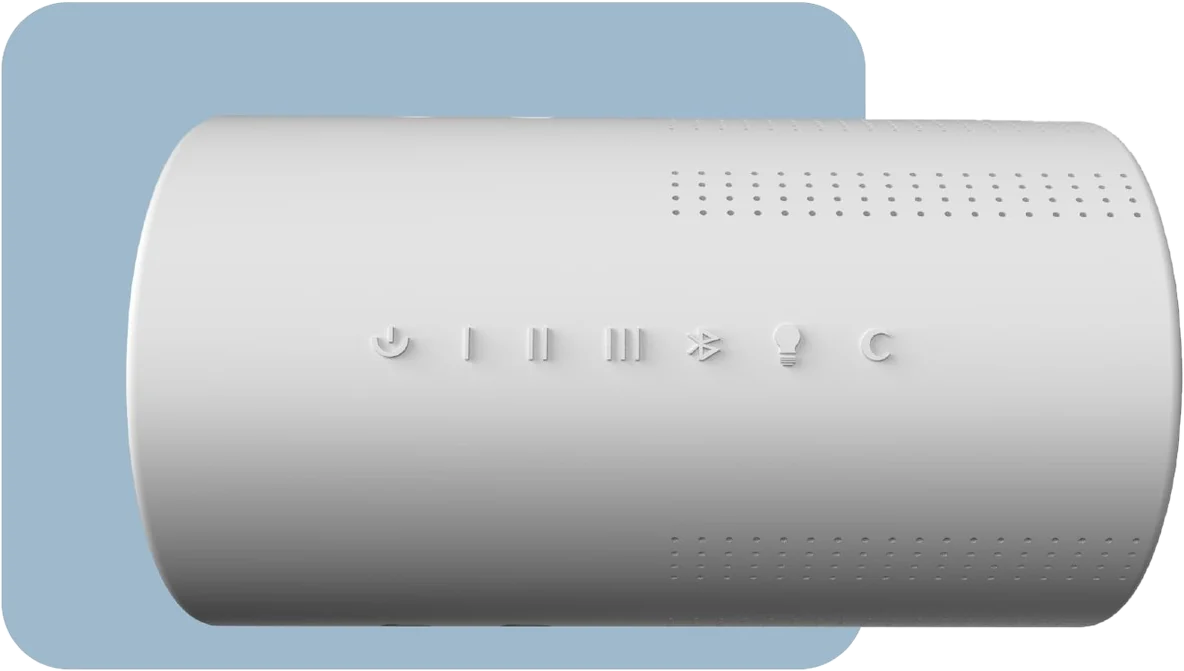
A soft, rounded body with embossed controls on the front, micro intake holes on top and clean air release holes underneath.
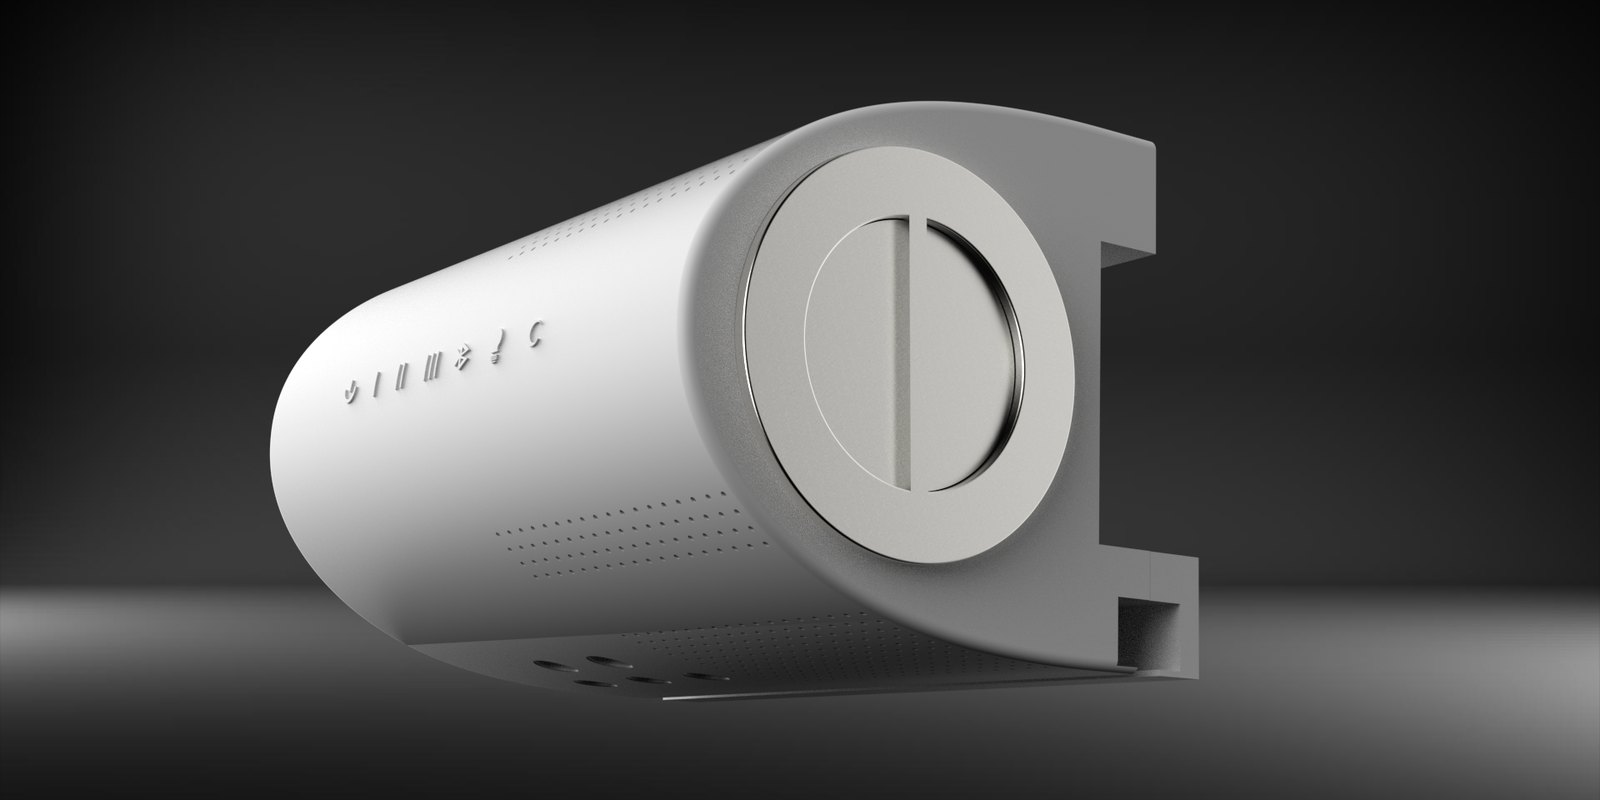
Embossed controls
Micro air intake holes
Clean air release holes
Easy-to-grip filter handle
Charging and power port
3M adhesives
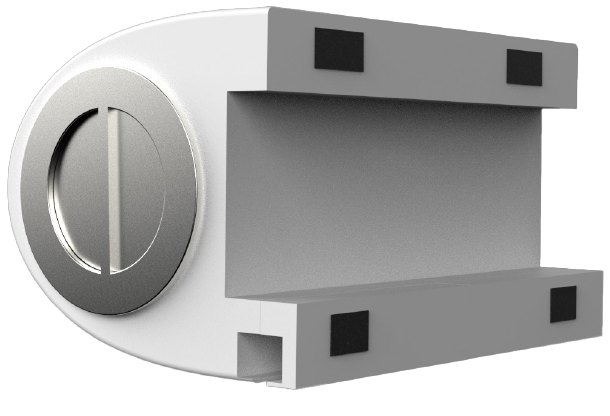 End
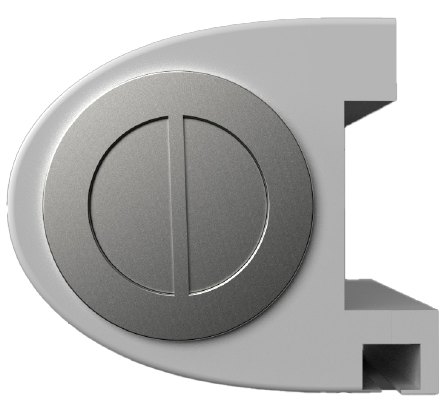 Side
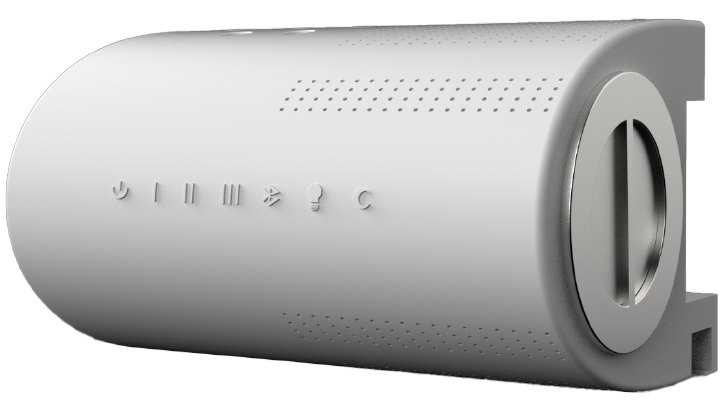 Angled
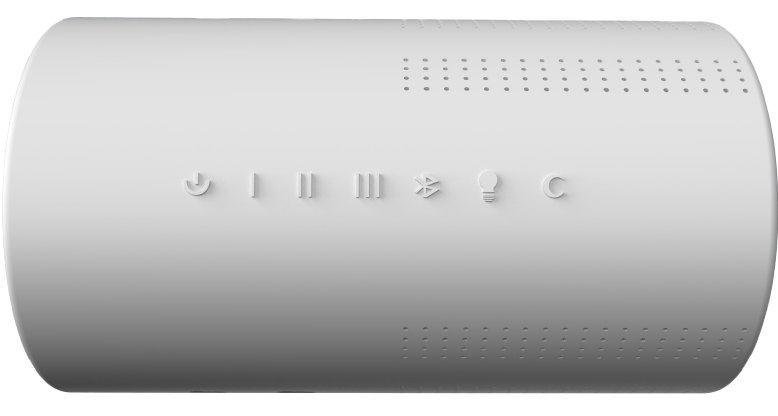 Front
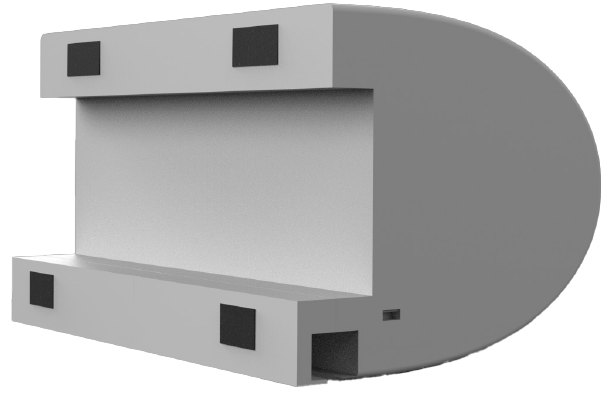 Back
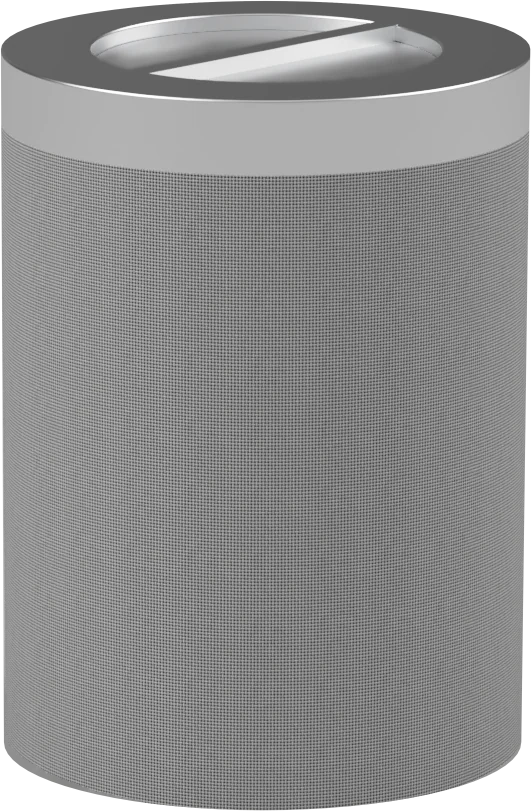
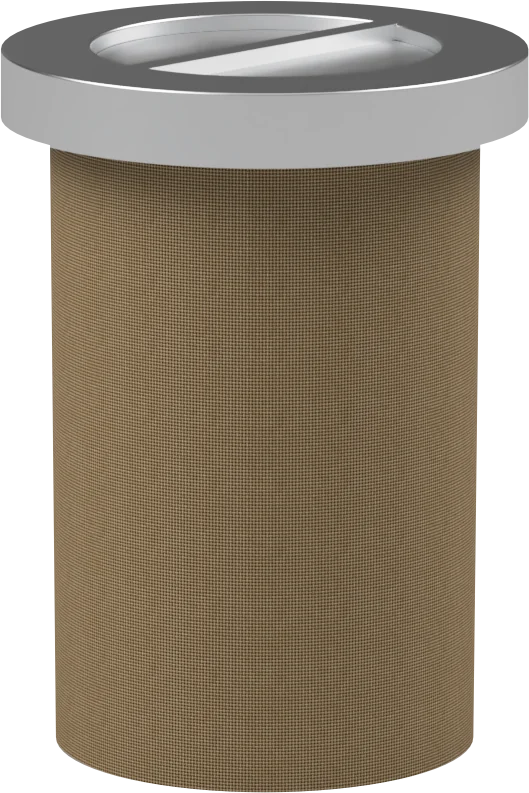
A cylindrical filter slides in from the side. A fan pulls air through it, and metal blades direct the clean air down toward the blinds.
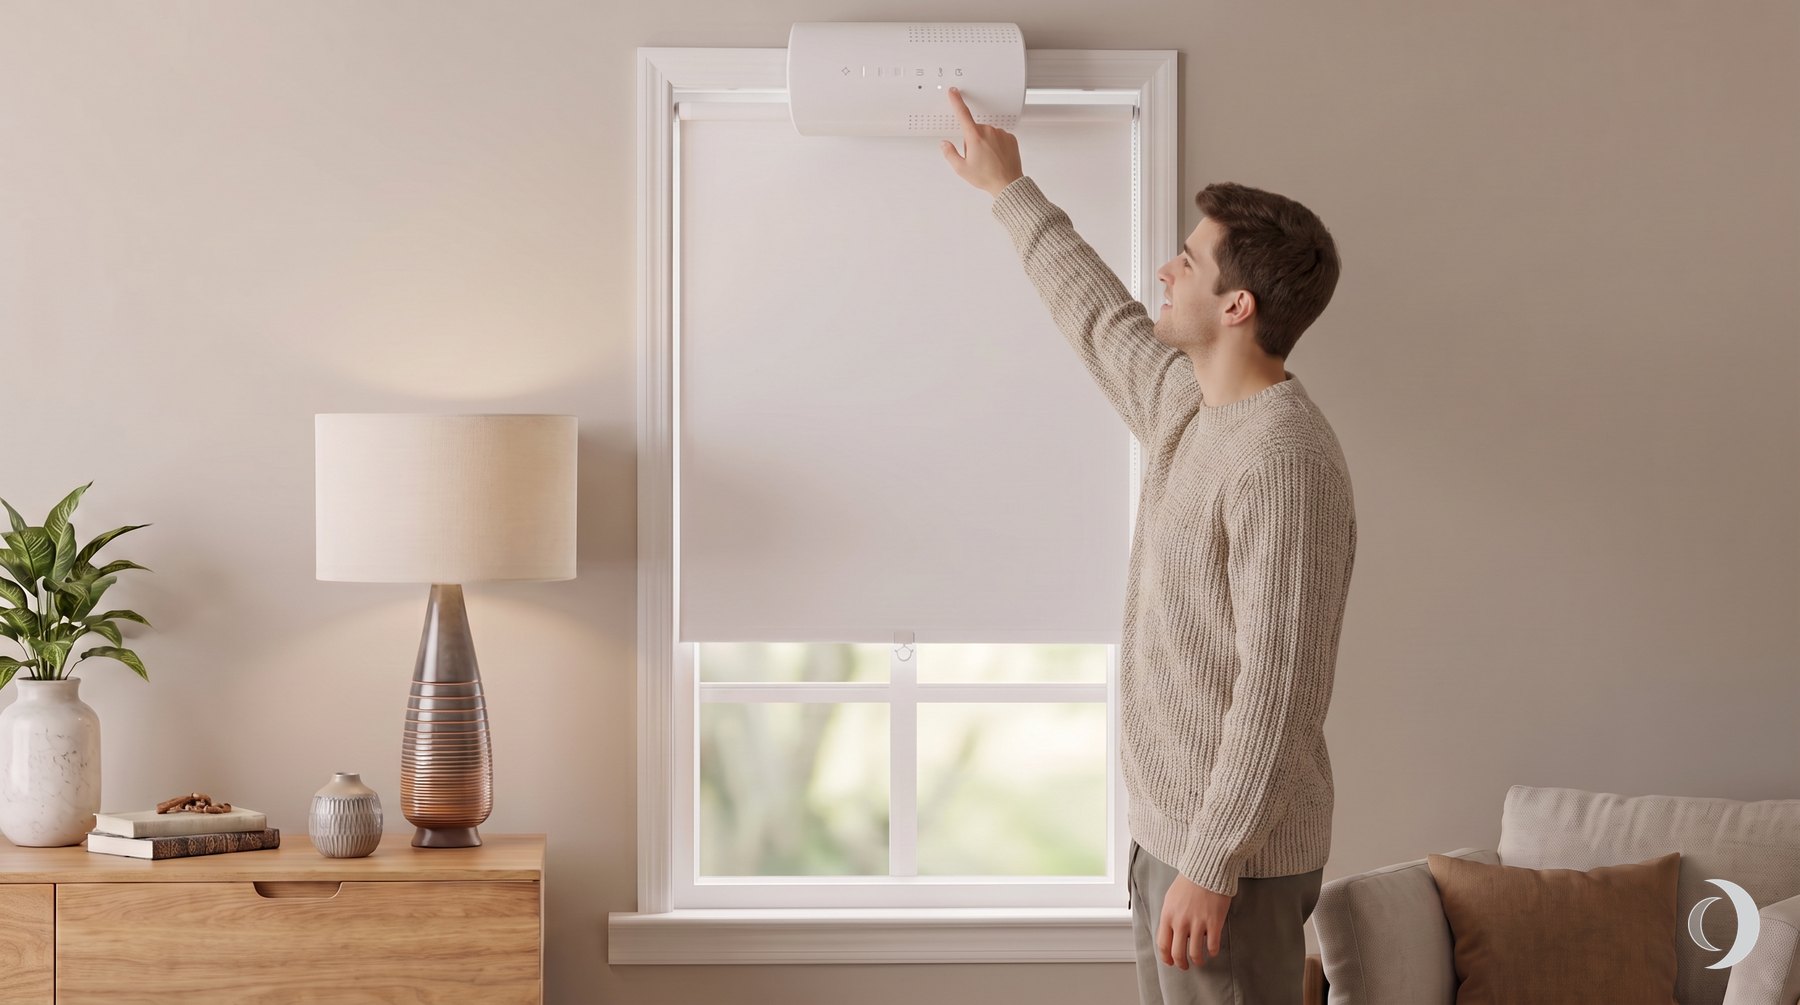
Kluno hangs from the window trim and holds the rod of your blinds, so the blinds hang from Kluno.
Adjust Kluno with the buttons on the front, or from the Kluno app if the window is too high.
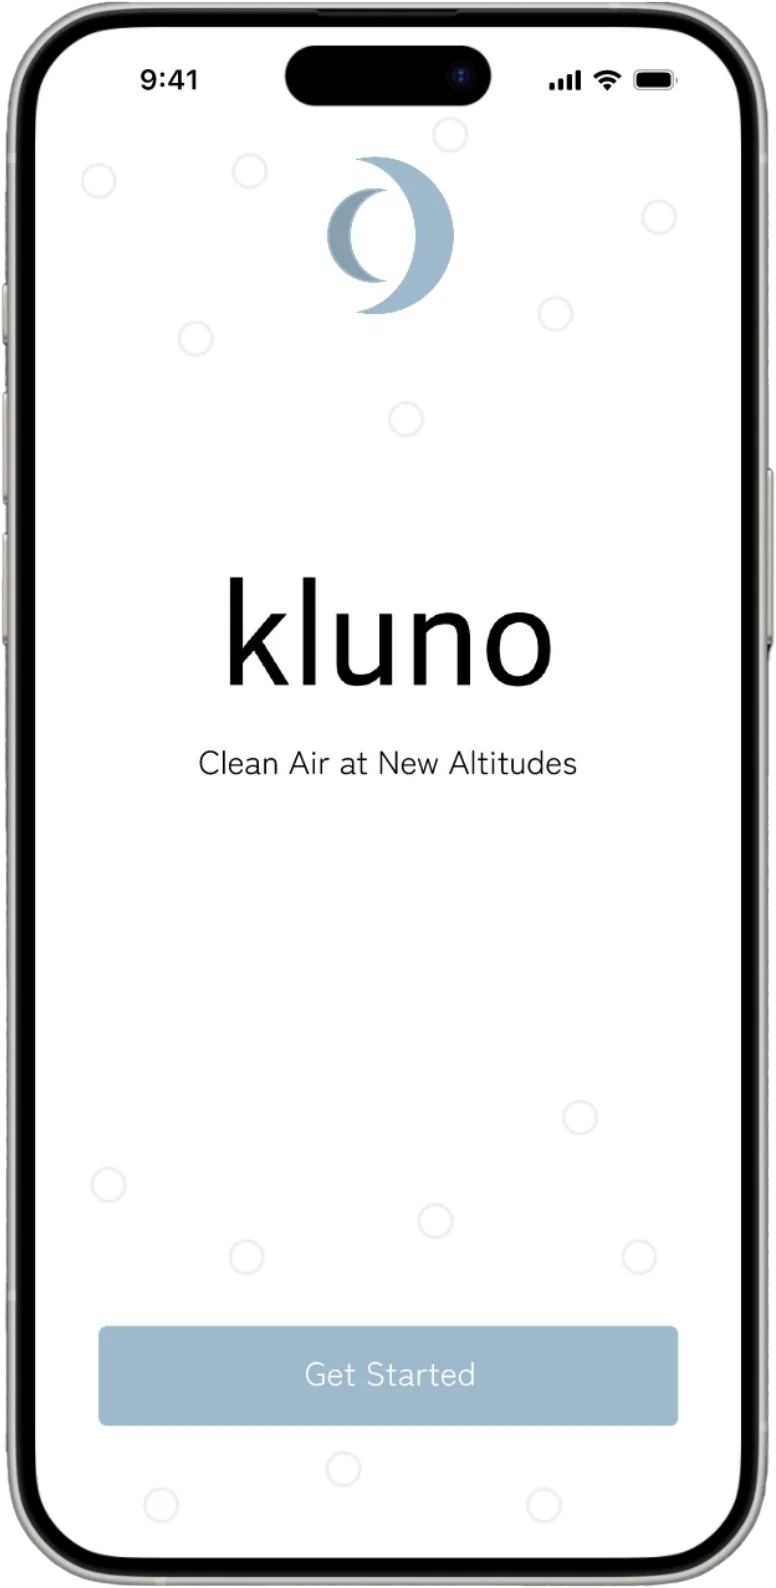
Pair your Kluno and get started.
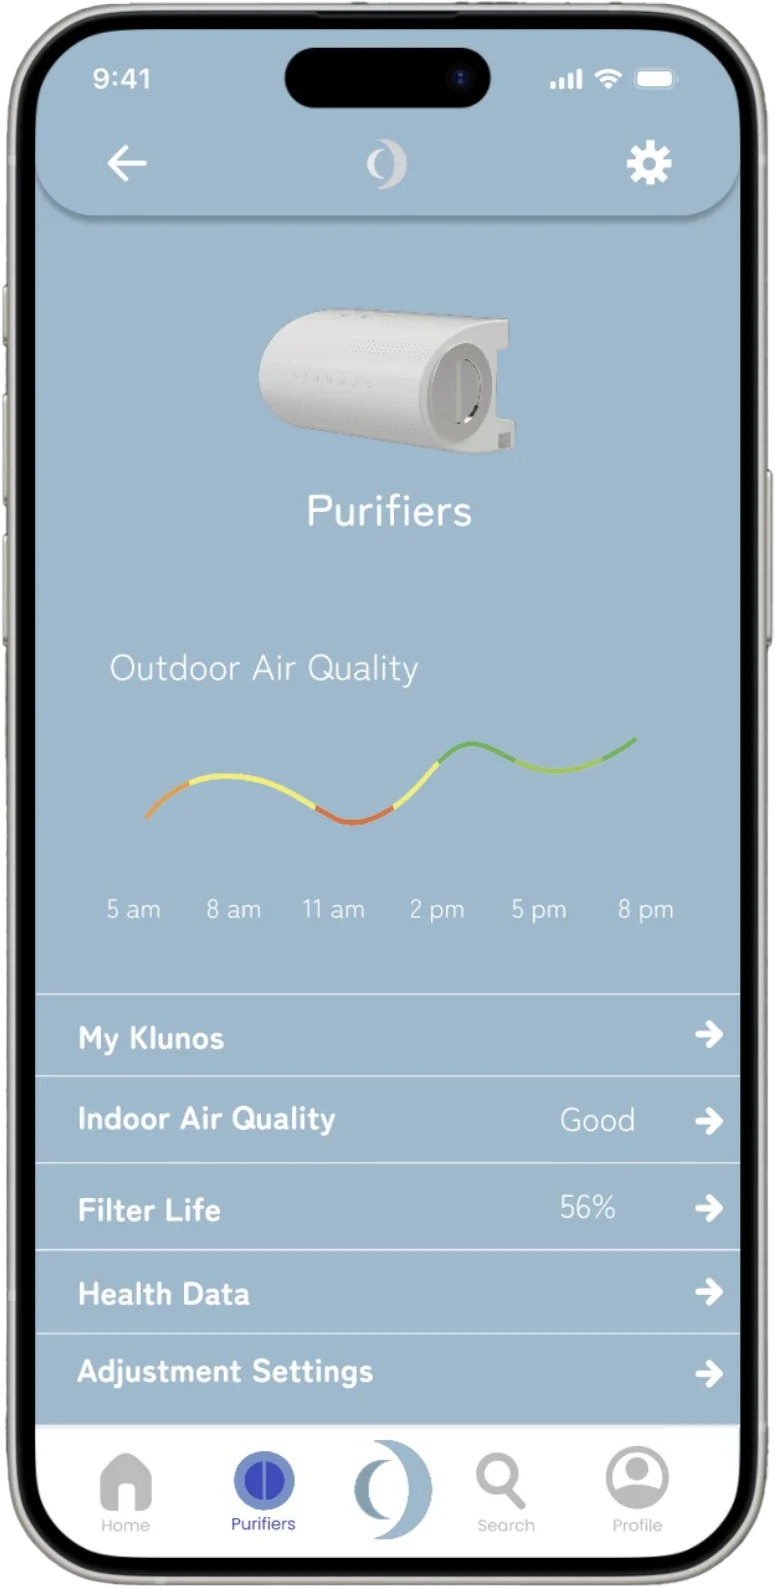
Air quality, filter life, health data and settings for every Kluno at home.
Build
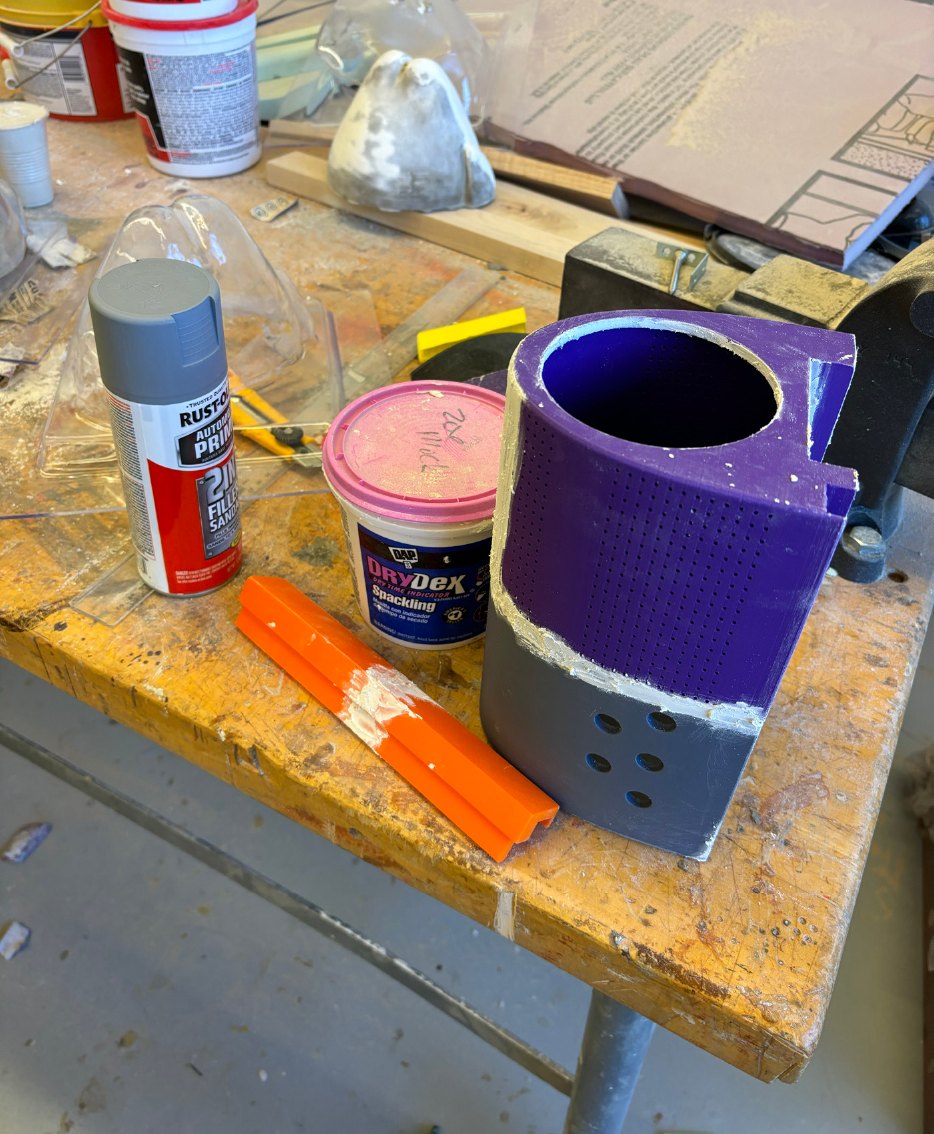
I modeled Kluno in Fusion 360, 3D printed the parts and finished them by hand into a 60% scale appearance model. Scaled down to fit printer capabilities.
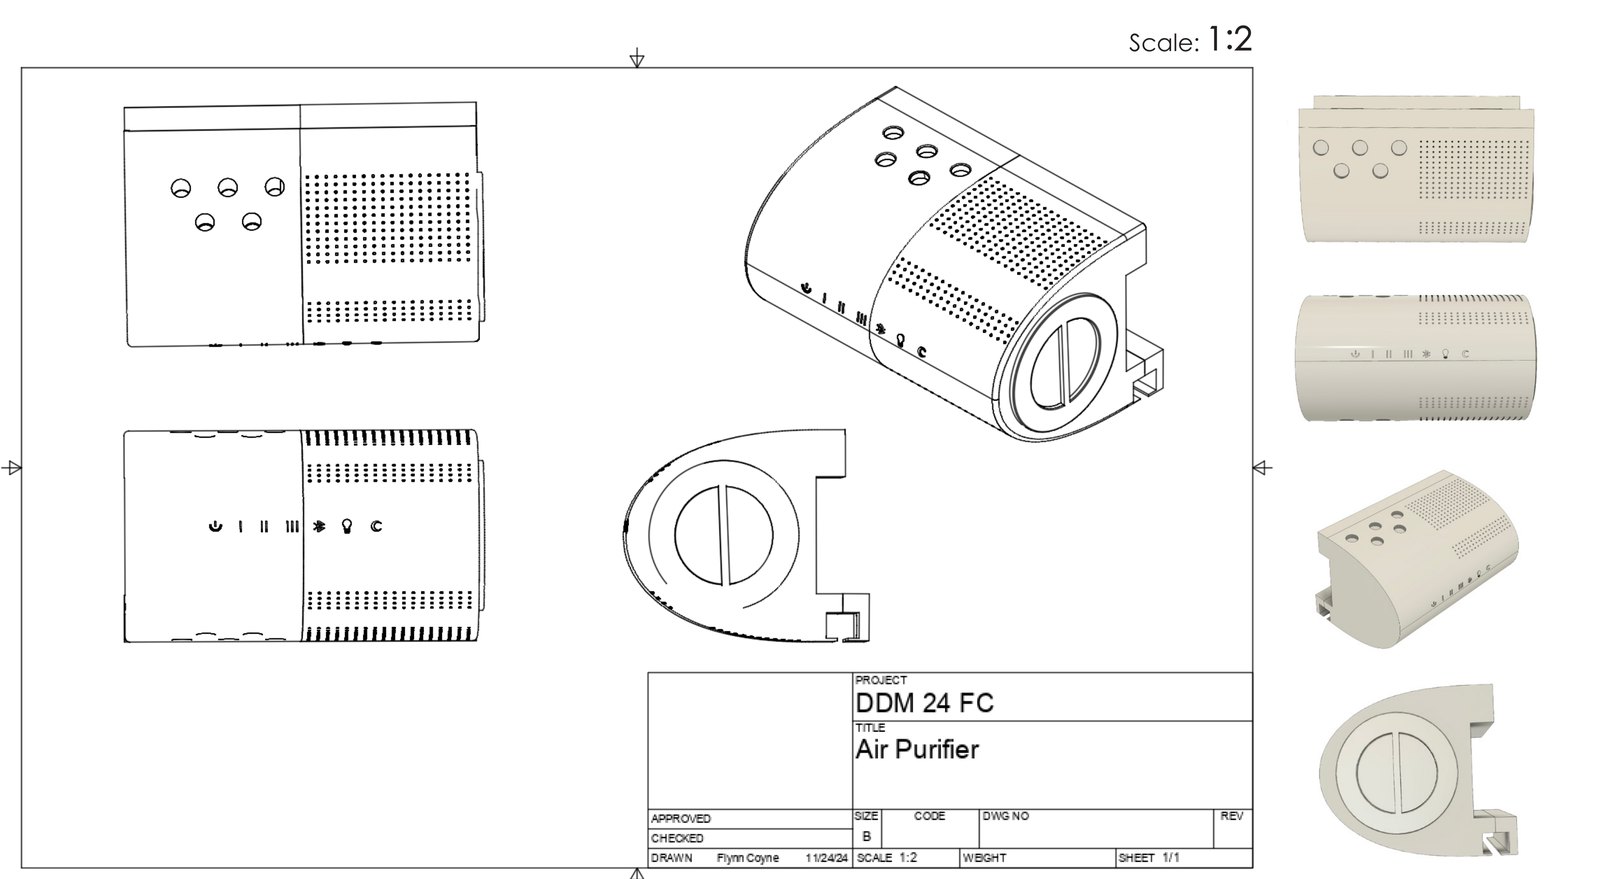
3D printed the purifier parts from the Fusion 360 model.
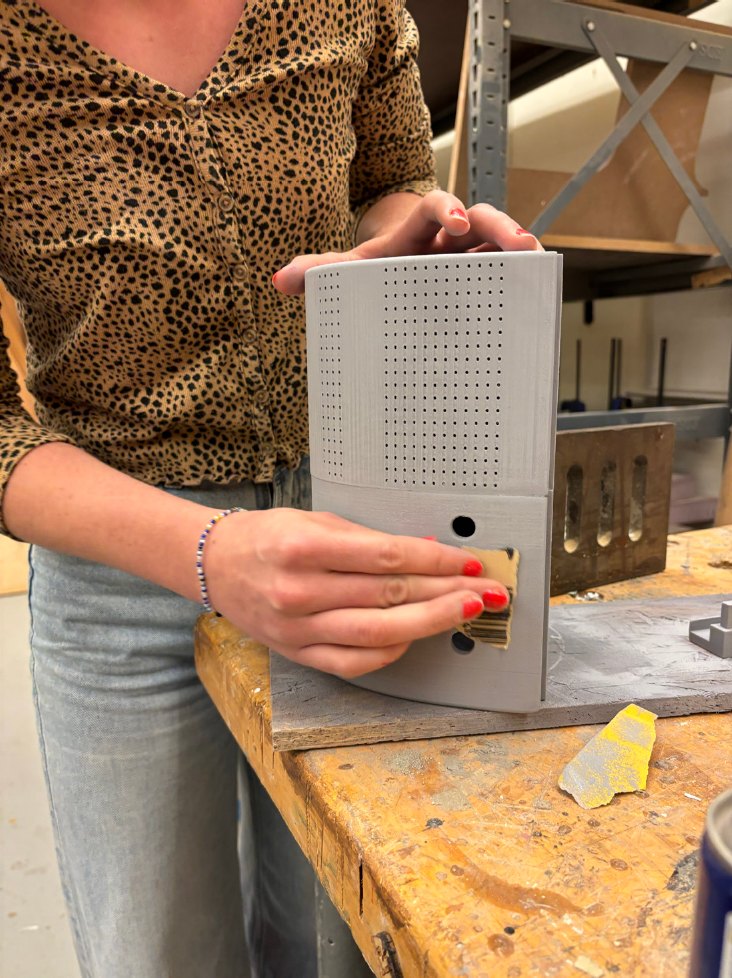
Spackled the gaps and seams, then sprayed sandable filler primer.
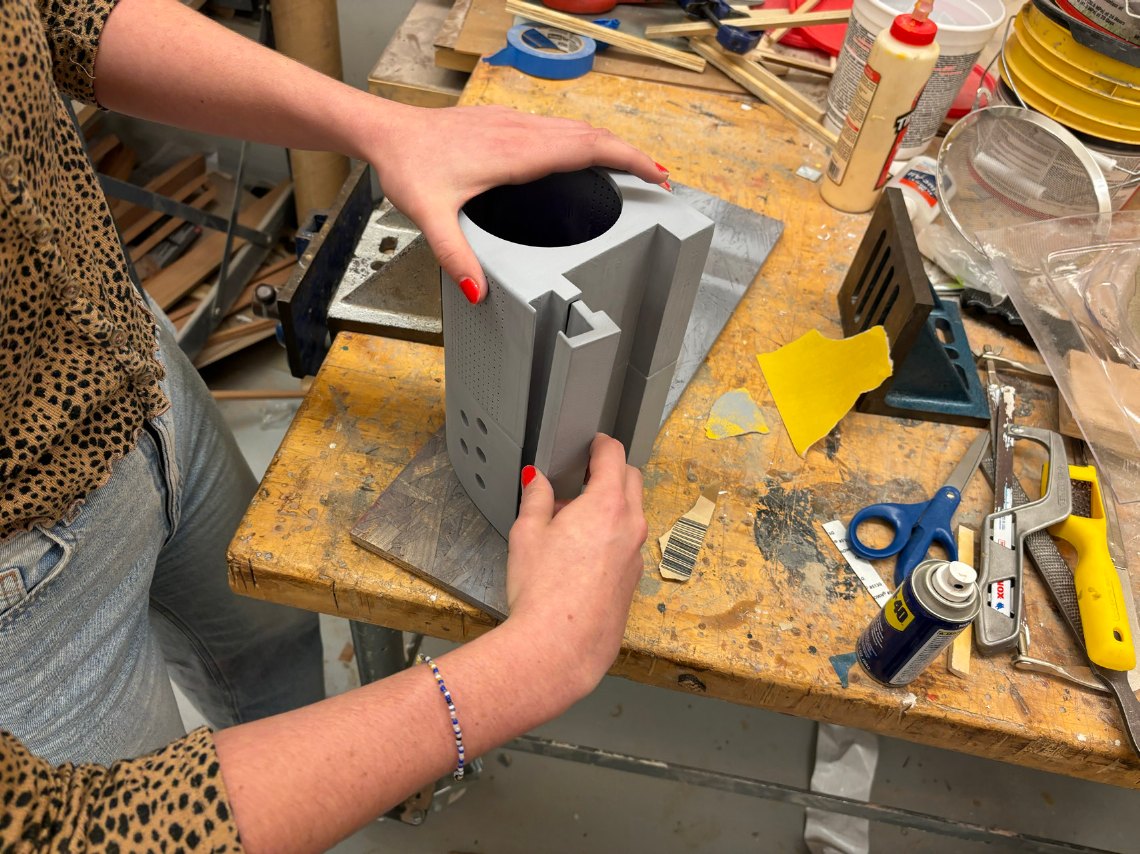
Spray painted the parts to match the finishes and materials in the CAD model.
Usage scenario
A classmate used the final scaled model to demonstrate changing the filter, mounting it, and the steps in between.
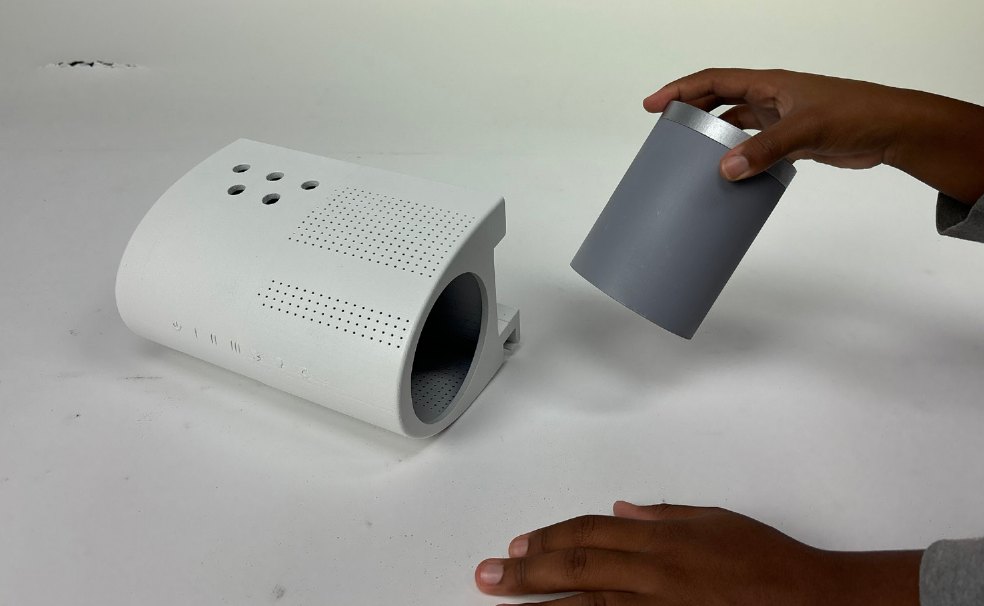
Take a clean filter and find the filter slot.
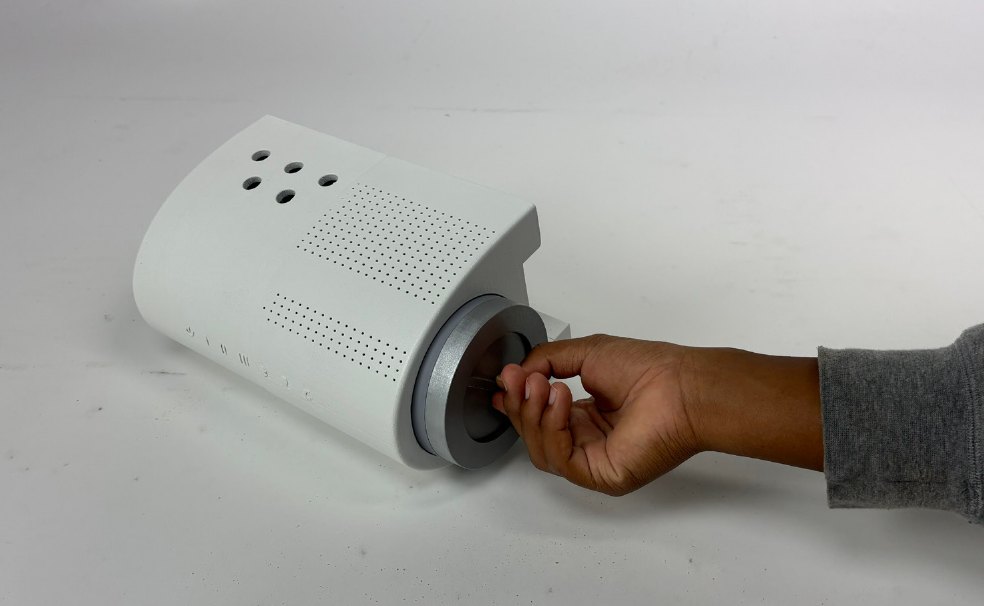
Slide the new filter into the side of your Kluno.
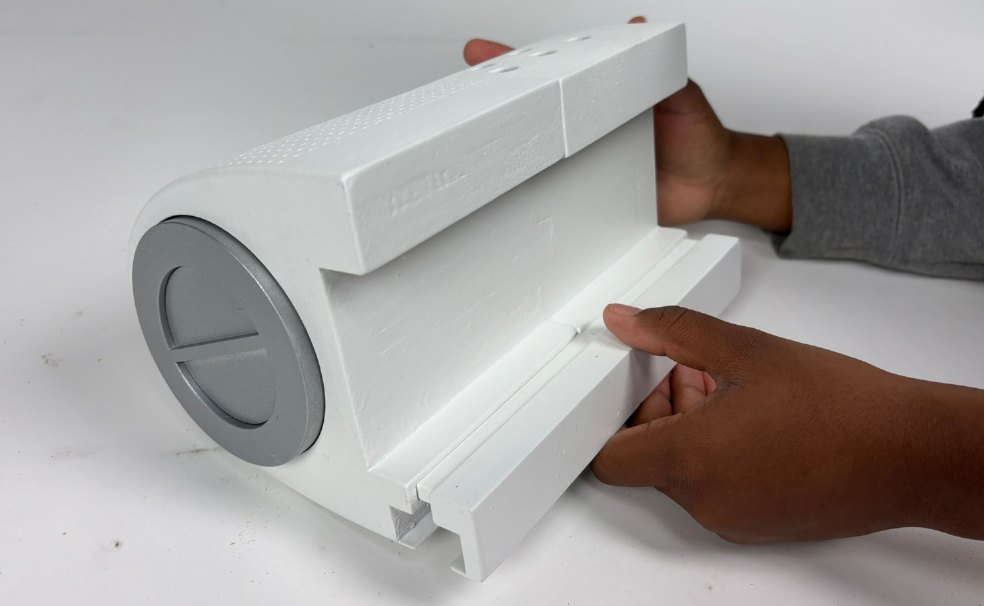
Pull out the blind stabilizer to widen the slot.
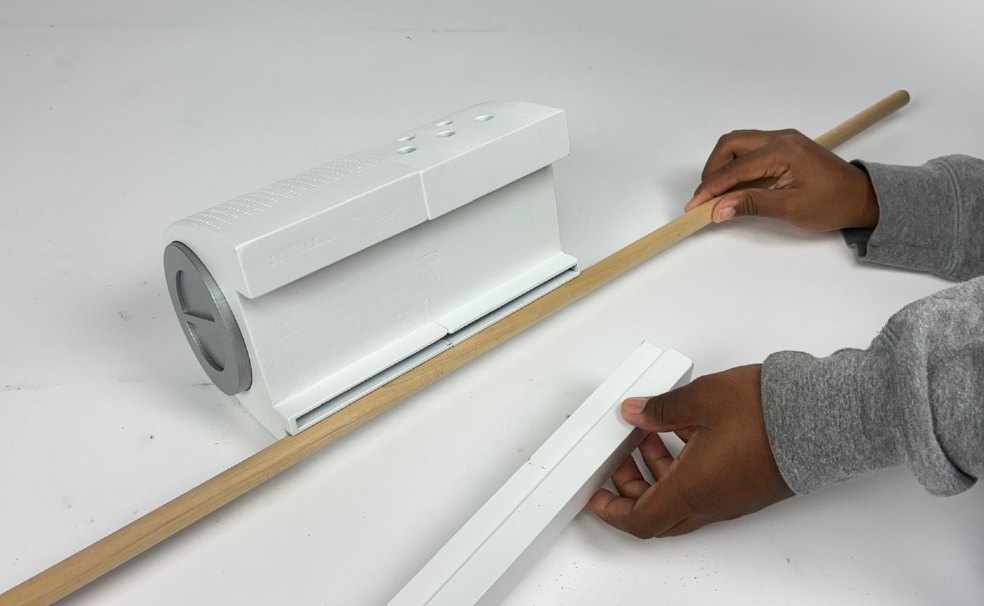
Place the rod of your blinds into the holder on the back.
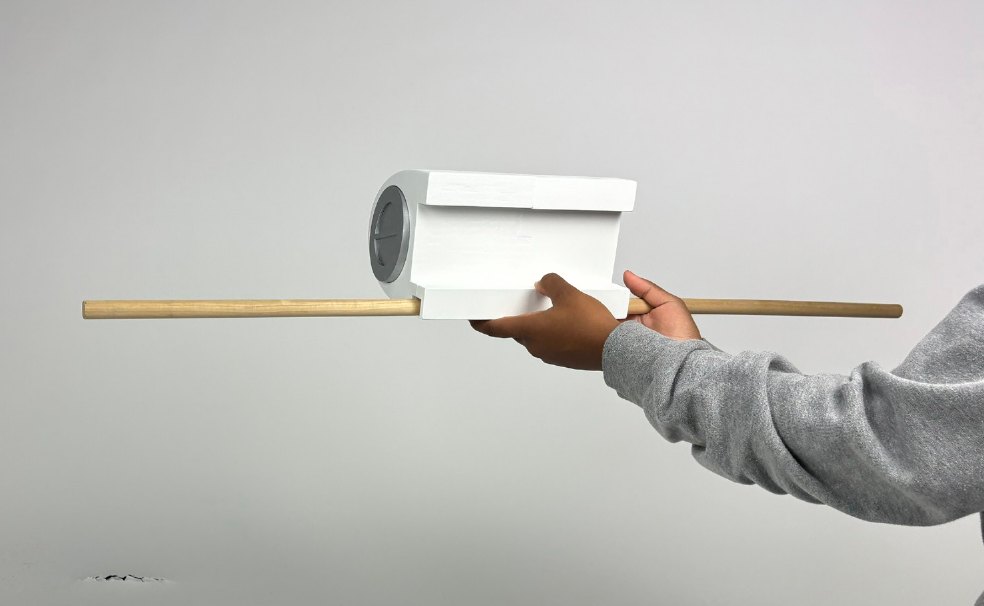
Lift Kluno to the top of the window and press it into place with the 3M adhesives.
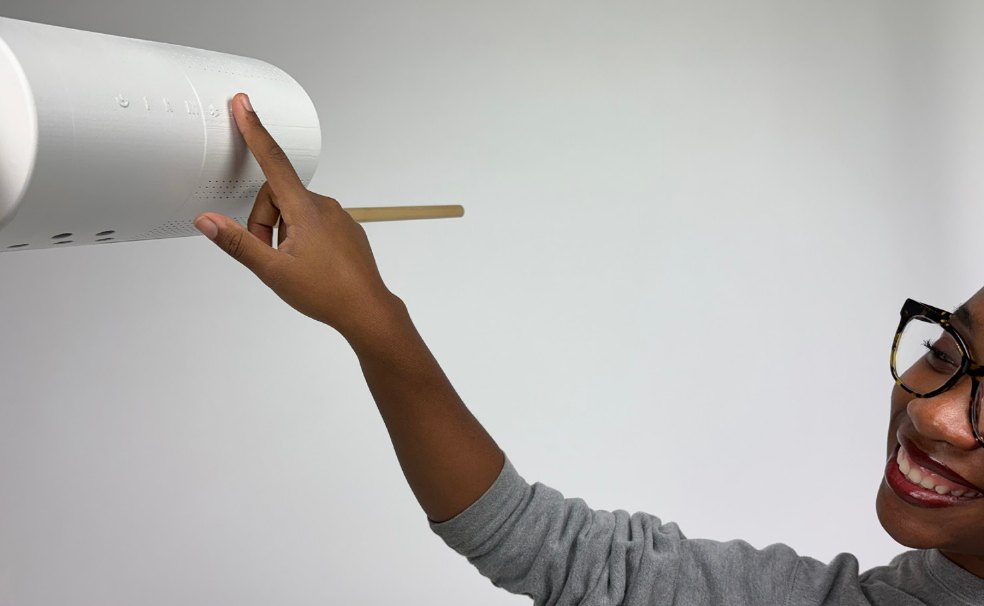
Adjust the settings with the buttons on the front, or from the app.
What I learned
Case study · Spring 2026
Caring for the people who keep cities moving.
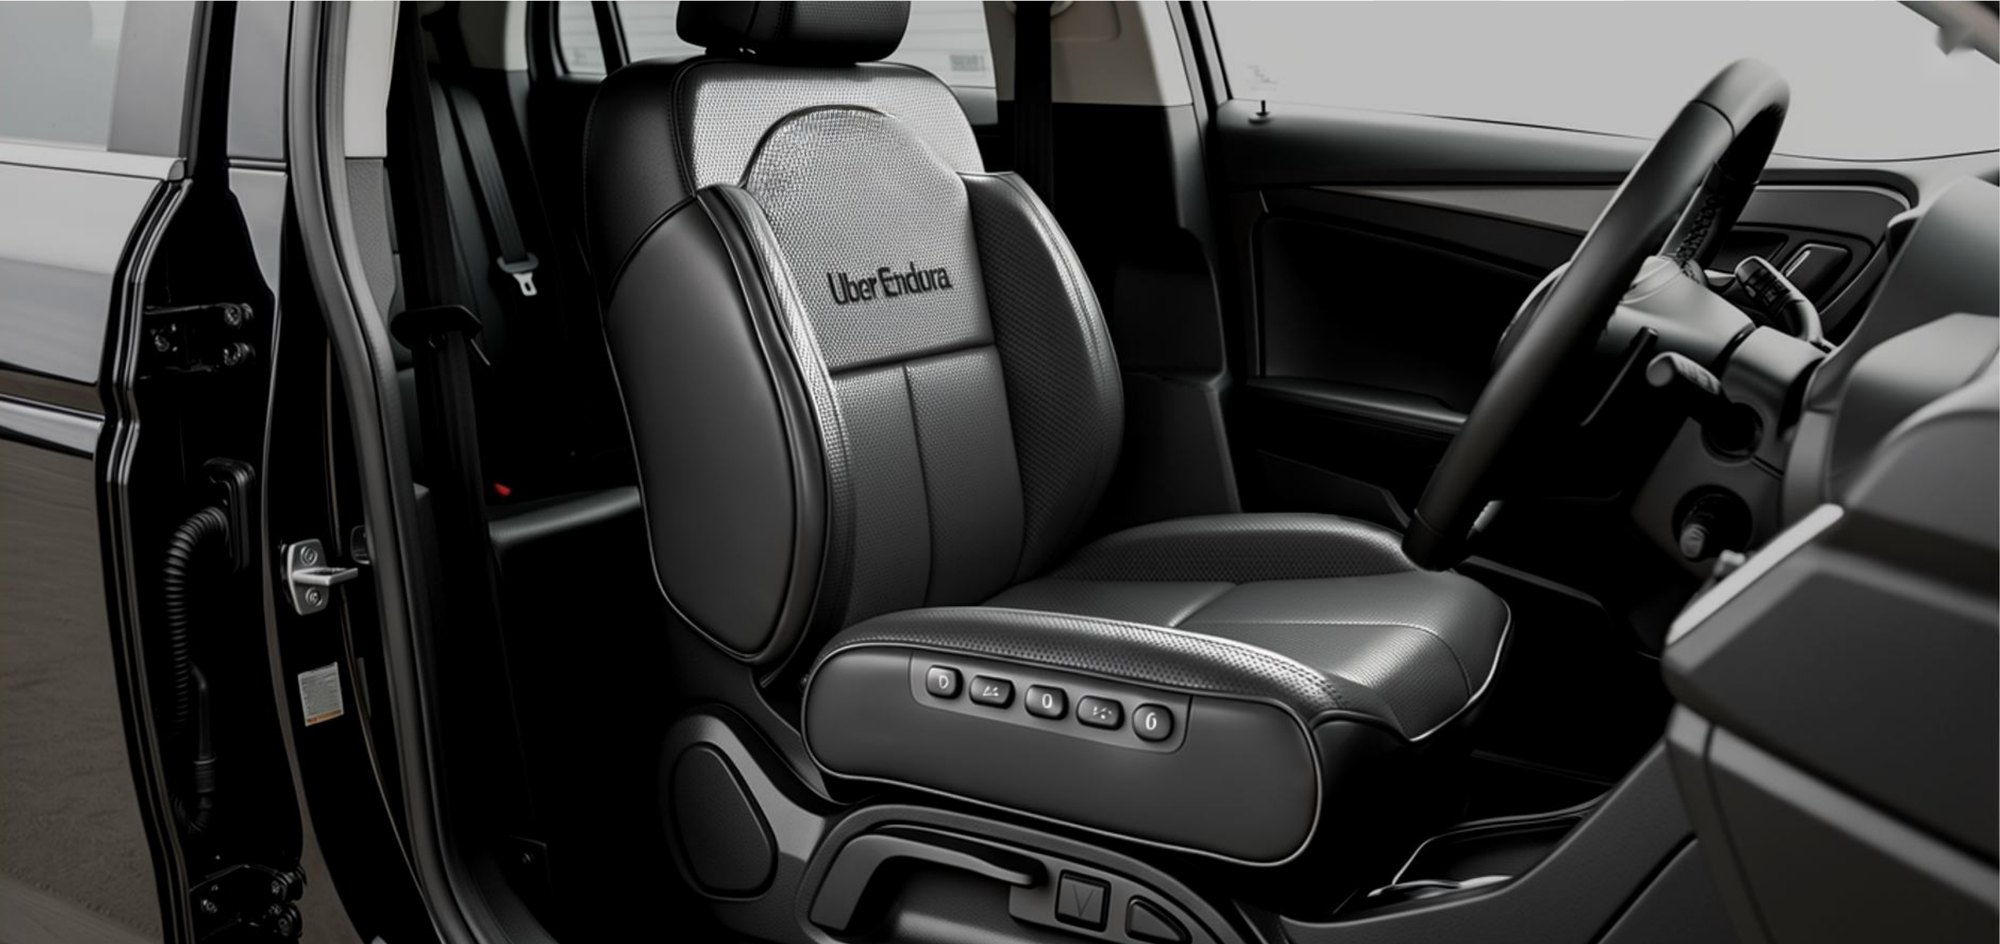
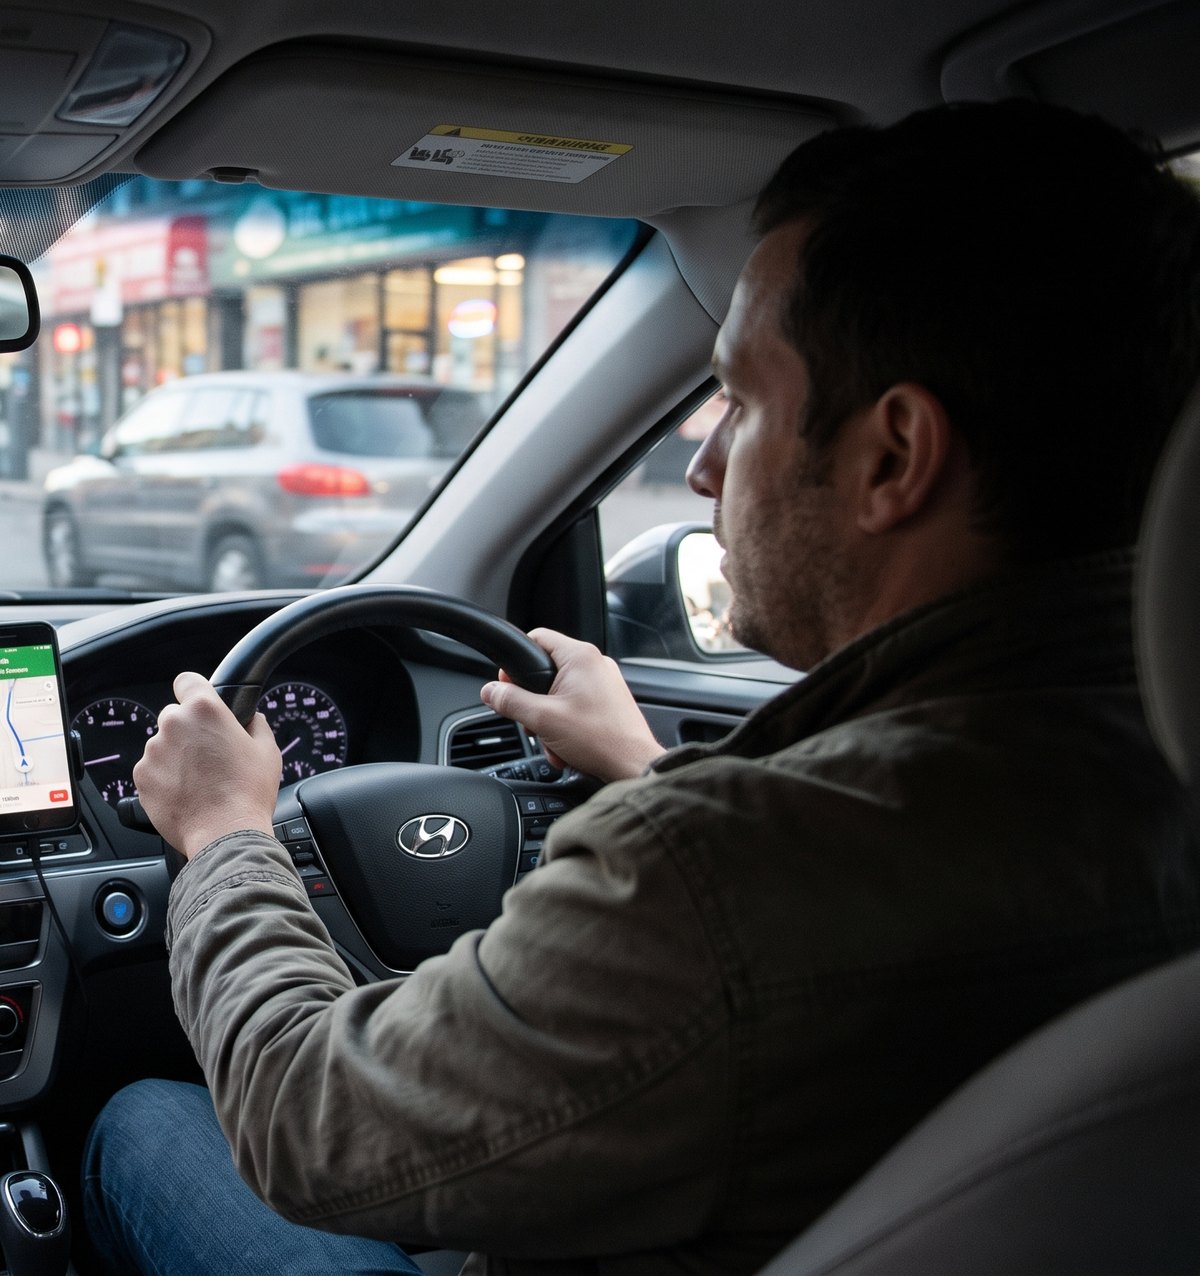
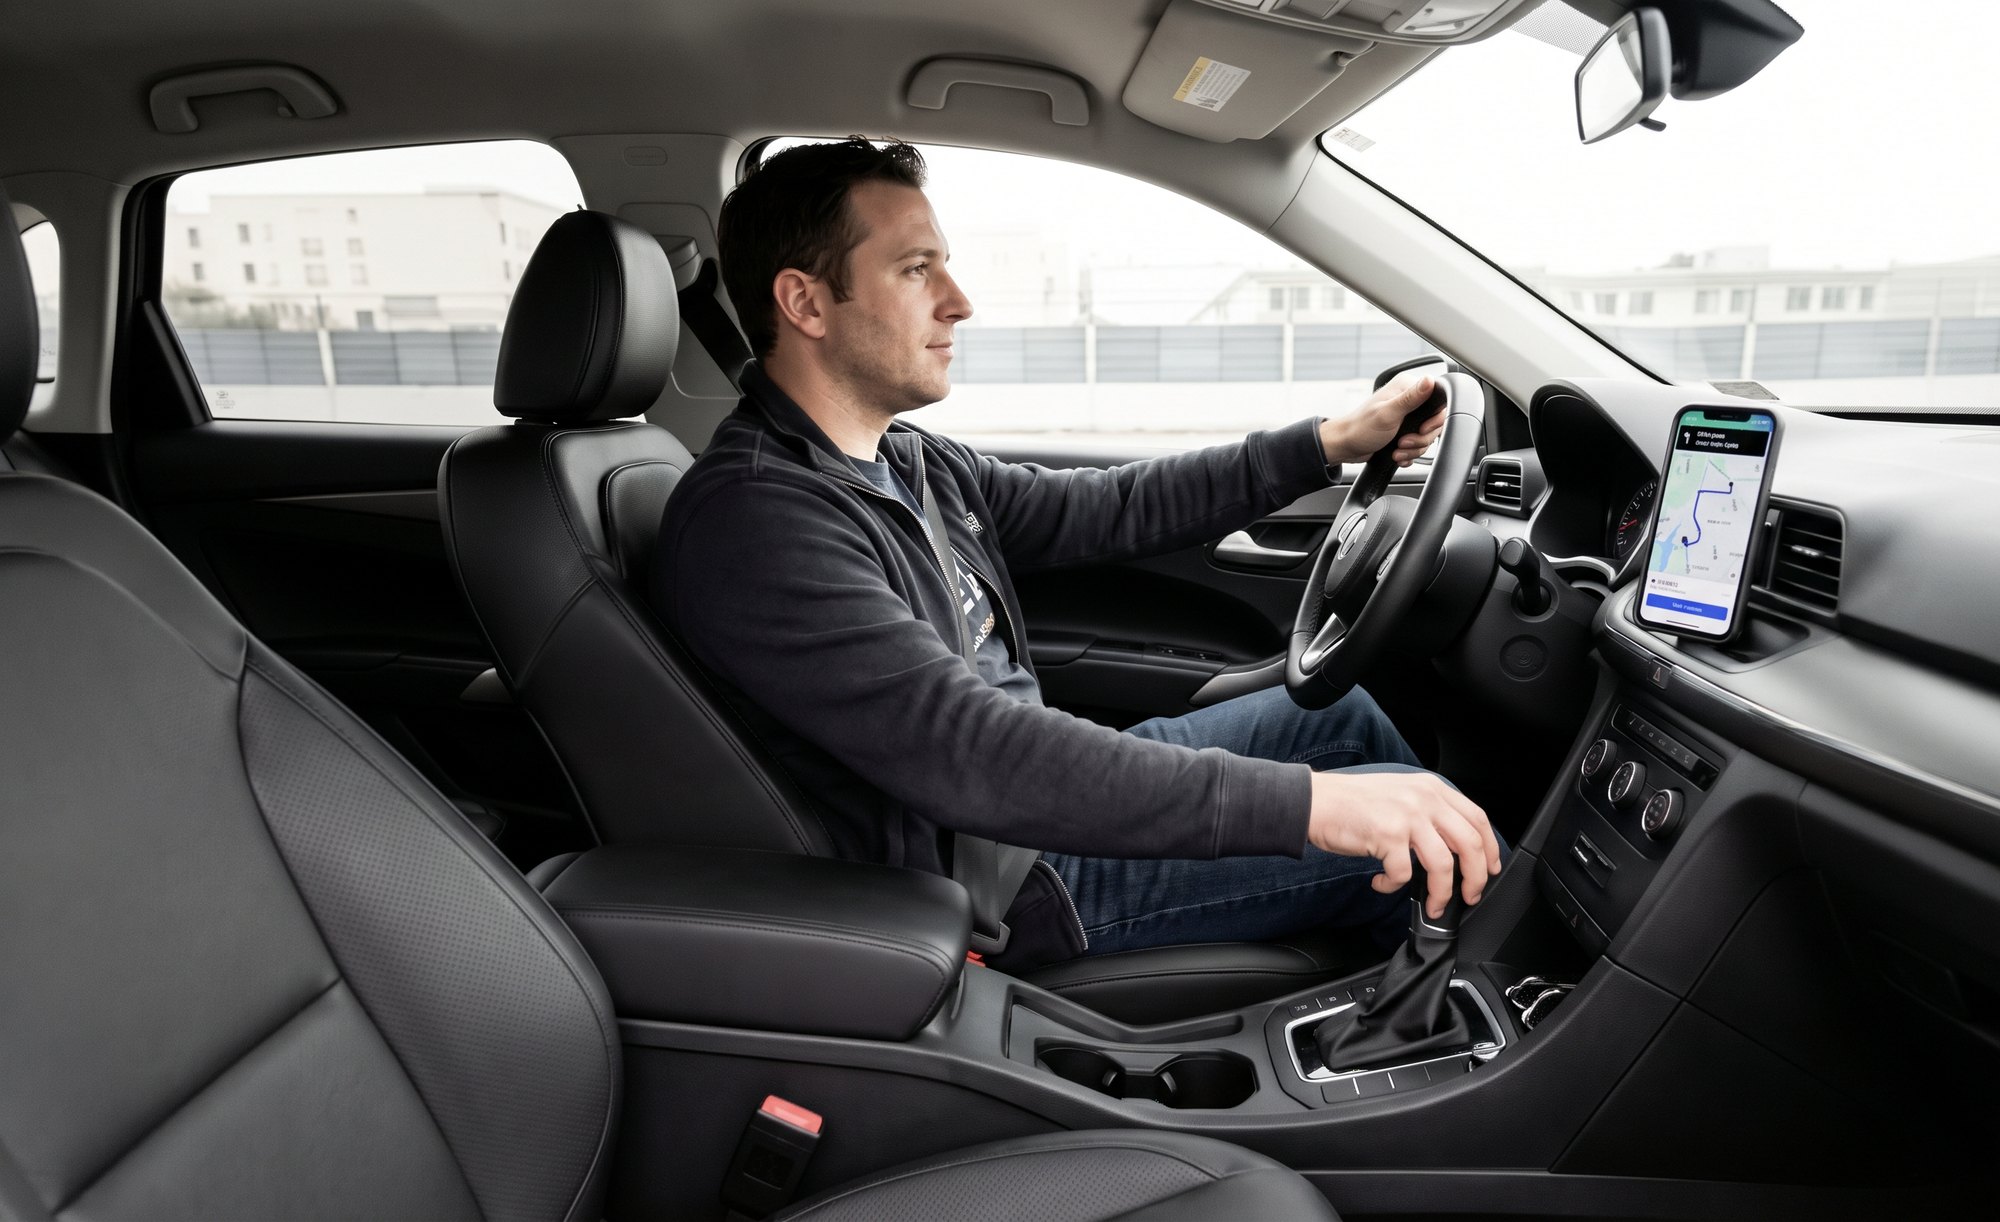
A seat cover for Uber drivers that turns hours of sitting into care. It responds to time on the road and signs of stress with lumbar support, pressure relief and massage, and it’s designed to look and feel like Uber.
The problem
Uber knows a lot about driver strain: how long someone has been driving, when, and in what conditions. Today it turns that knowledge into incentives, not care. Meanwhile drivers sit for hours at a time, and it shows up as back pain, legs falling asleep, poor sleep and stress.
Why is the driver’s body the only part of the system that runs without maintenance?
Uber’s products center on connecting people with services through its app, from rides to deliveries to scooters. None of them look after the drivers who make it all run.
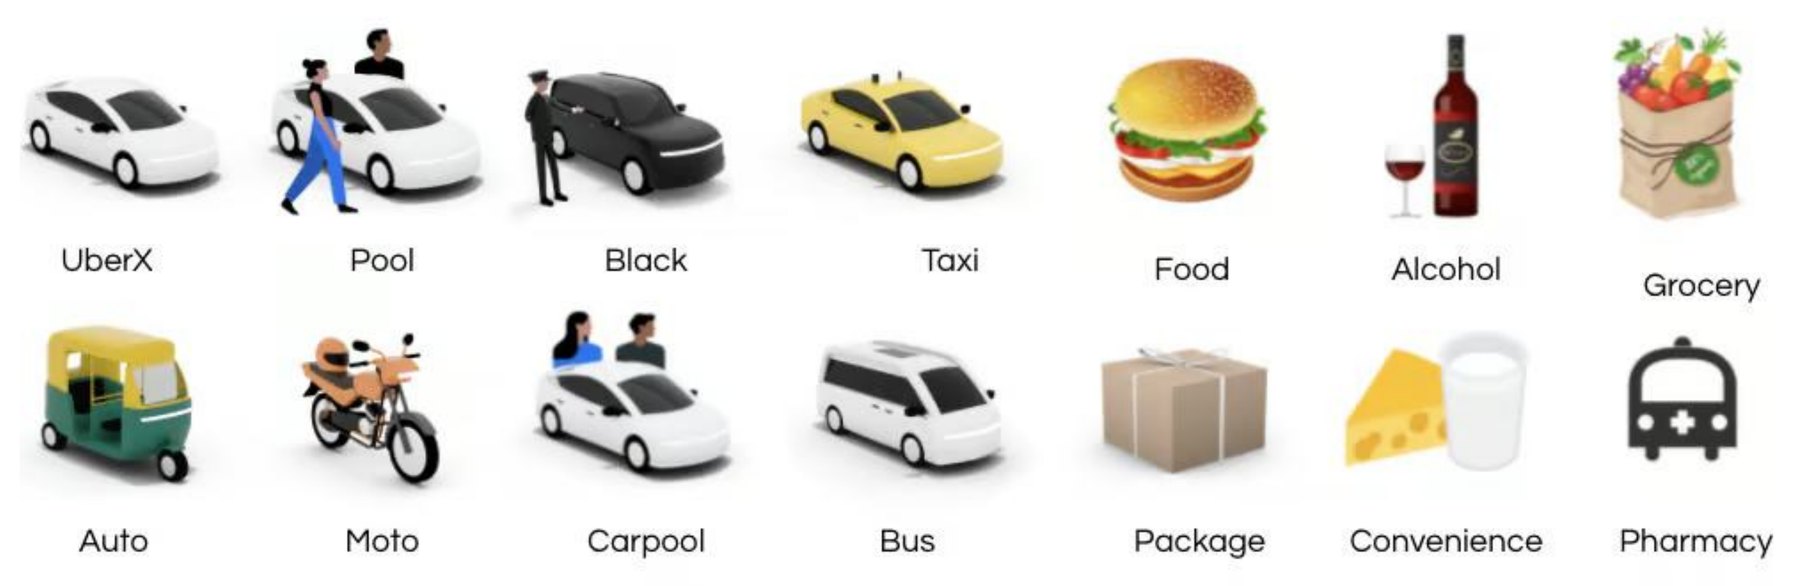
UberX, Uber Comfort, Uber Black, Uber Green, Uber WAV, Uber Taxi, UberXL, Uber Reserve, Hourly, Uber Intercity, Uber Shuttle
Uber Eats, Uber Connect, Uber Pet, Uber Health, Uber for Business, Uber Freight
Scooters and bikes, Uber Rent, Uber Transit
Research
Uber Endura had to read as an Uber product at first glance. I studied Uber’s mission, values, color palette, product voice and typography, and let them guide every design decision.

“Igniting opportunity by setting the world in motion.”
Primary
#000000#FFFFFFSecondary accents
#276EF1#06C167#FFC043Optimistic, confident, approachable and direct.
Matte signals stability. Gloss appears in motion to guide the eye.
Uber Move, a custom sans-serif drawn from the geometry of road signs and maps.
Uber already has a health product. Uber Health lets healthcare organizations book rides for patients. It’s built around patients and clinics, not the person driving.

“Healthcare organizations can help resolve patients’ transportation issues by requesting door-to-door non-emergency medical transportation (NEMT) and wheelchair rides from credentialed drivers directly in a centralized, easy-to-use dashboard or an API.”
— Uber Health
| Uber Health | Uber Endura | |
|---|---|---|
| Who it serves | Patients | Drivers |
| Approach | Reactive | Preventative |
| Where it happens | Clinics | The road and the city |
| Relationship | Transactional | Long-term |
| Puts first | The institution | The worker |
Two personas kept me focused on different kinds of drivers: a full-time driver supporting a family, and a student driving late at night.
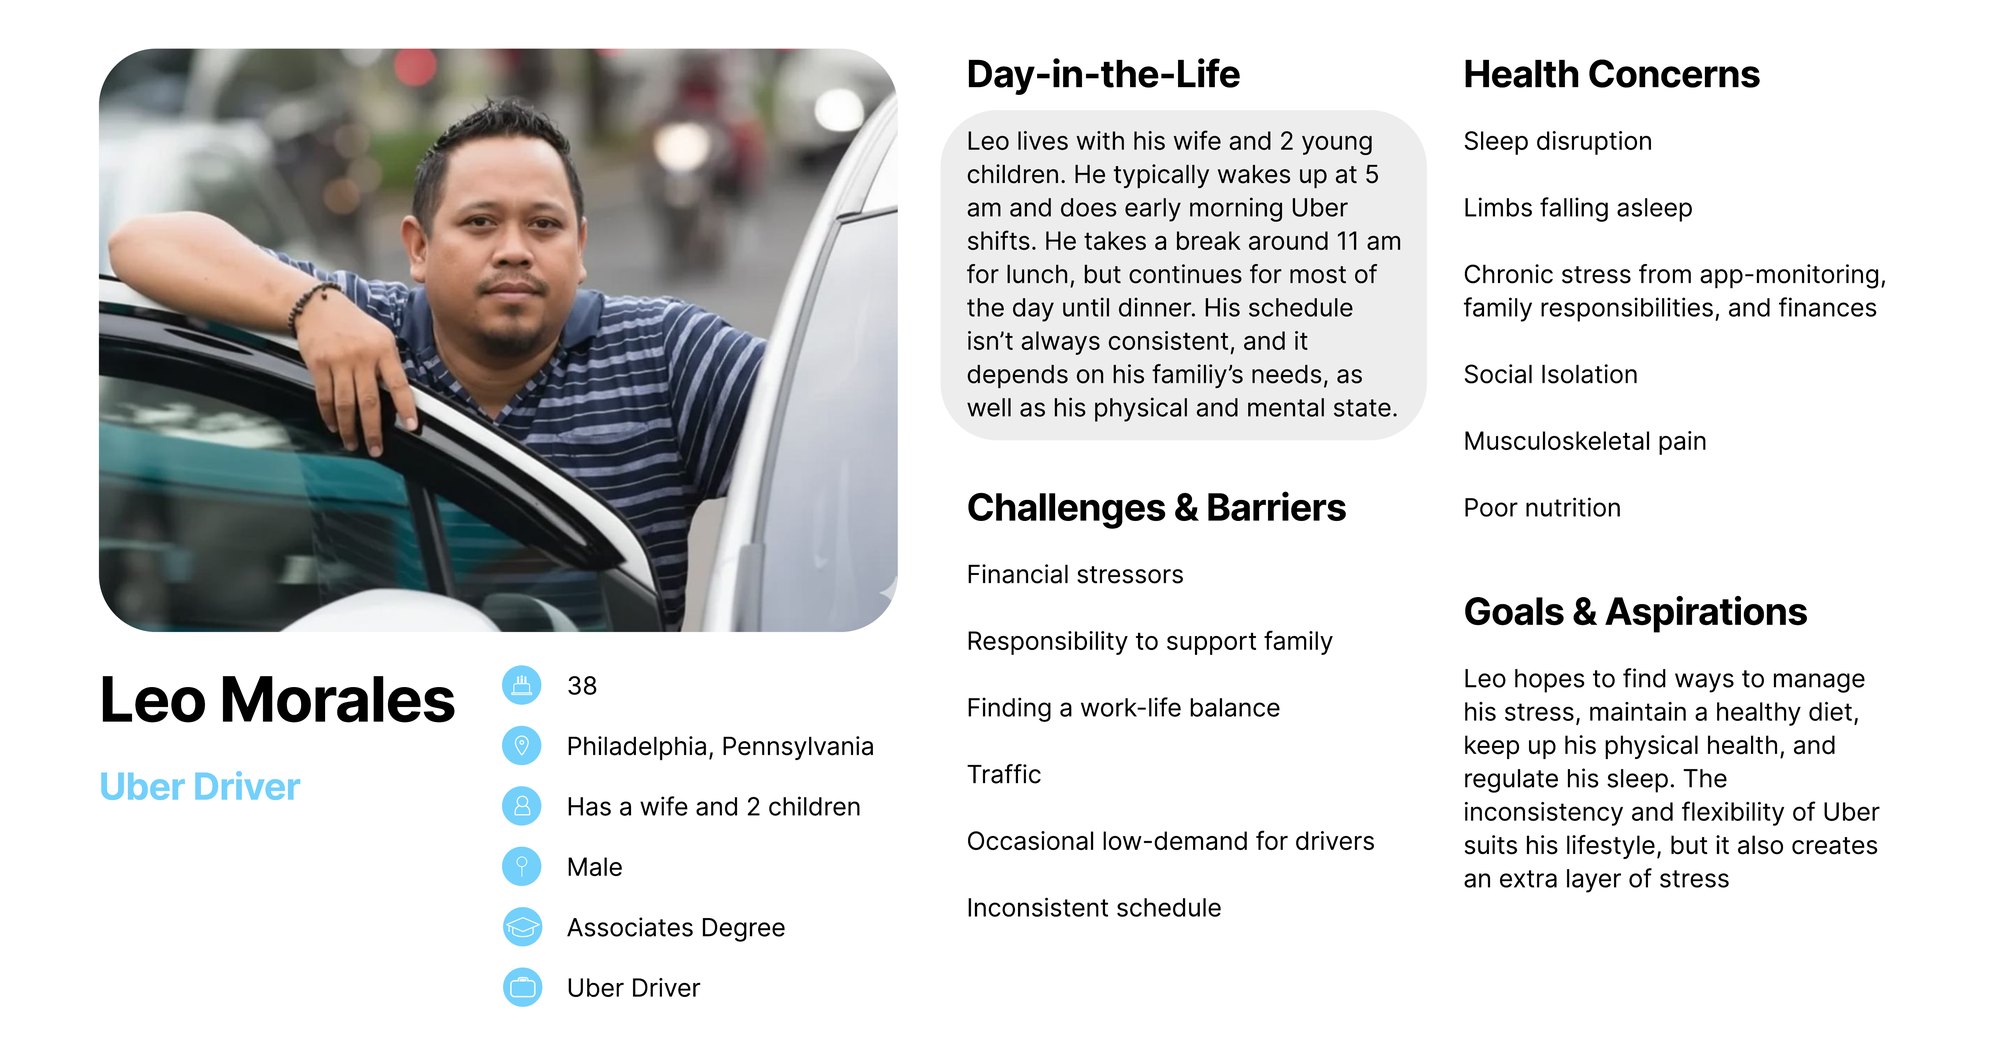
Uber driver
Leo wakes up at 5 am for early-morning shifts, breaks for lunch around 11 and keeps driving until dinner. His schedule shifts with his family’s needs and how he feels physically and mentally.
Manage his stress, eat well, stay healthy and regulate his sleep. Uber’s flexibility fits his life, but its inconsistency adds stress.
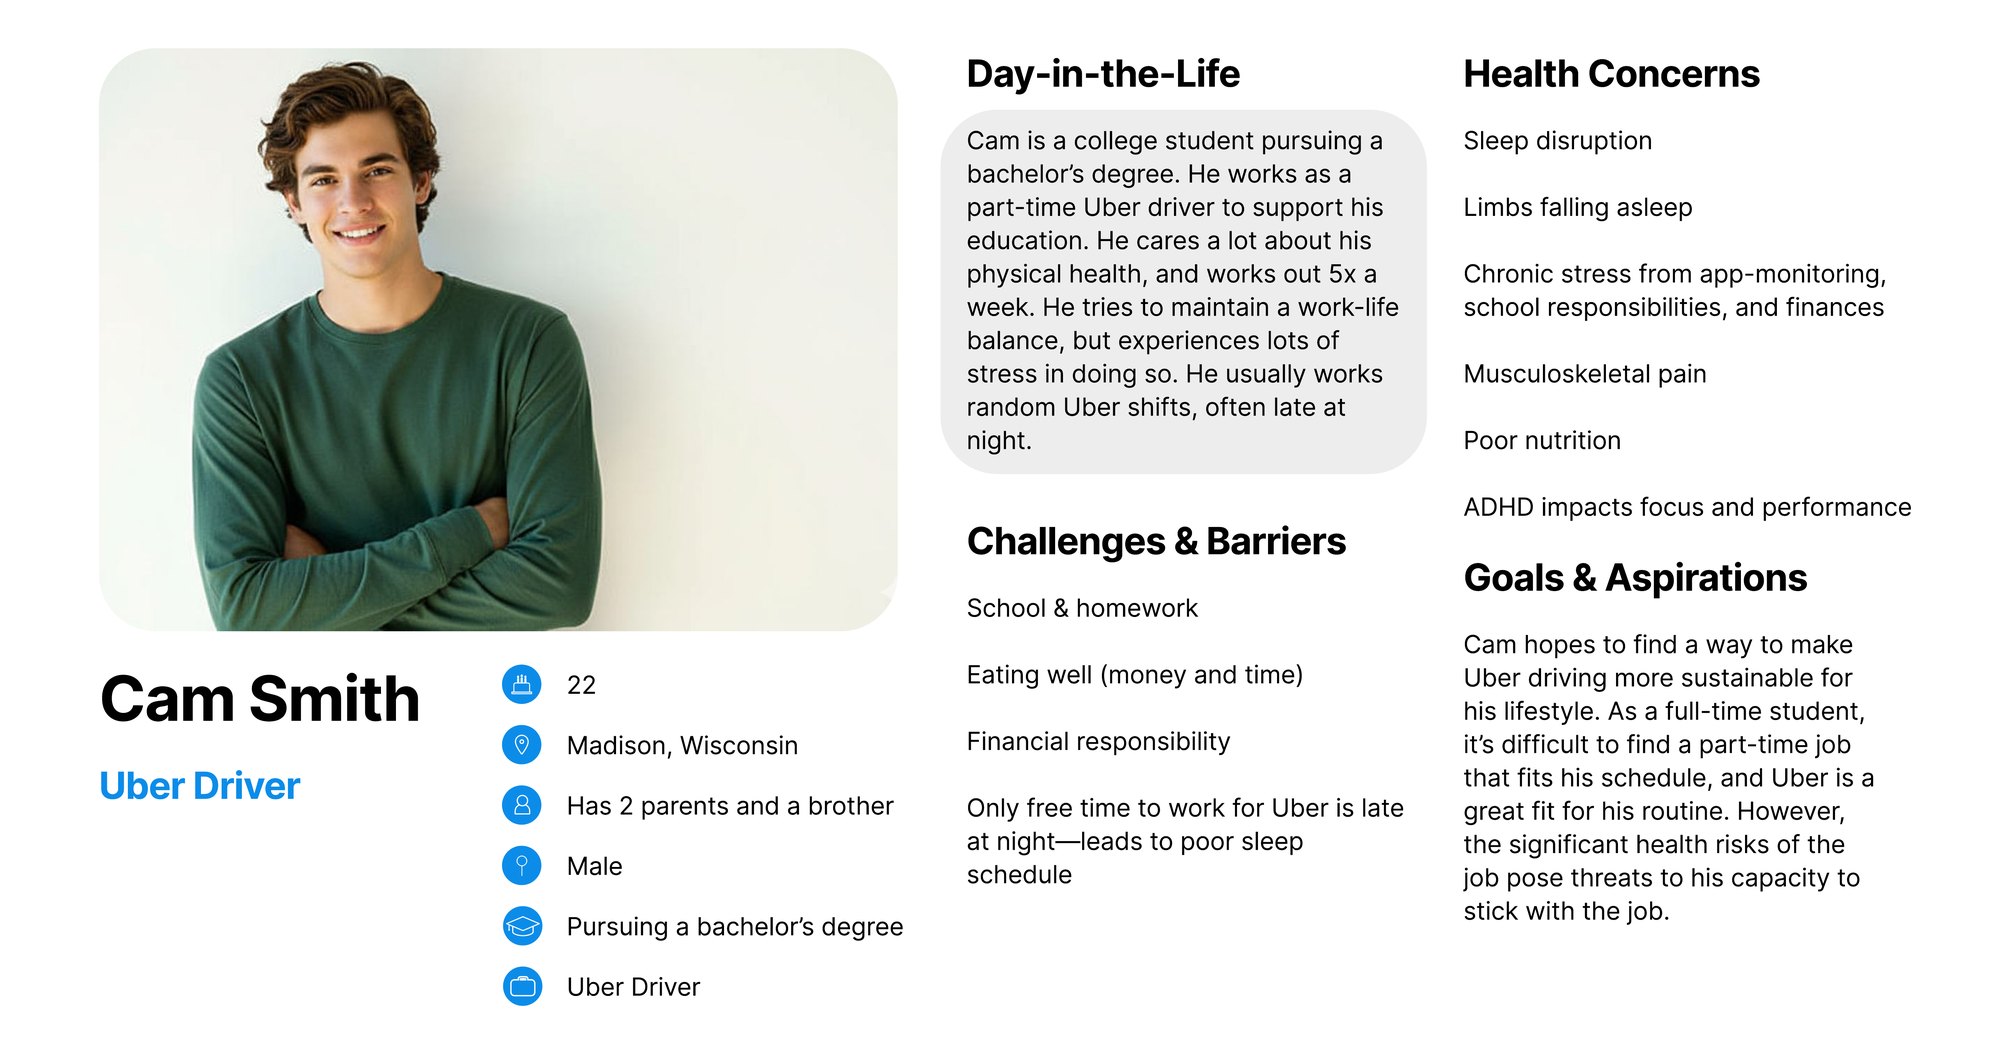
Uber driver
Cam drives part-time to pay for school and works out five times a week. He tries to balance work and life, but it’s stressful, and his shifts are often late at night.
Make Uber driving sustainable alongside school, without the job’s health risks wearing him down.
Define
Design objective
Design a driver-centric seat cover that turns passive sitting into active care, translating time and stress indicators into preventative physical support that helps Uber drivers sustain their bodies and focus through long shifts.
Ideation
I sketched 30 thumbnails across the car and the driver’s body: steering wheel covers, foot platforms, light bars, glasses, gloves, seat covers and more.
I pushed three ideas further, each one easing strain in a different way.
A seat cover that massages, supports and calms the driver in response to stress or time, between rides or based on driving patterns.
Glasses whose lenses darken when a ride ends to signal a break, with calming vibrations, heating and cooling, and day and night modes.
An end-of-ride marker that signals a mental reset, with lighting that changes based on the last ride’s length and the stress it detects.
I took the seat direction forward and developed it into a supportive seat cover.
What I changed
After a mid-project in-class review and a conversation with my professor, we decided it was worth extending the seat cover farther up the back. The taller backrest gives drivers more support and more room for stress relief, not just a cushion to sit on.
Final design
The time- and stress-responsive seat cover that makes driving a sustainable practice. It slides over the driver’s seat, and buttons on the side of the cushion control support, pressure and massage.

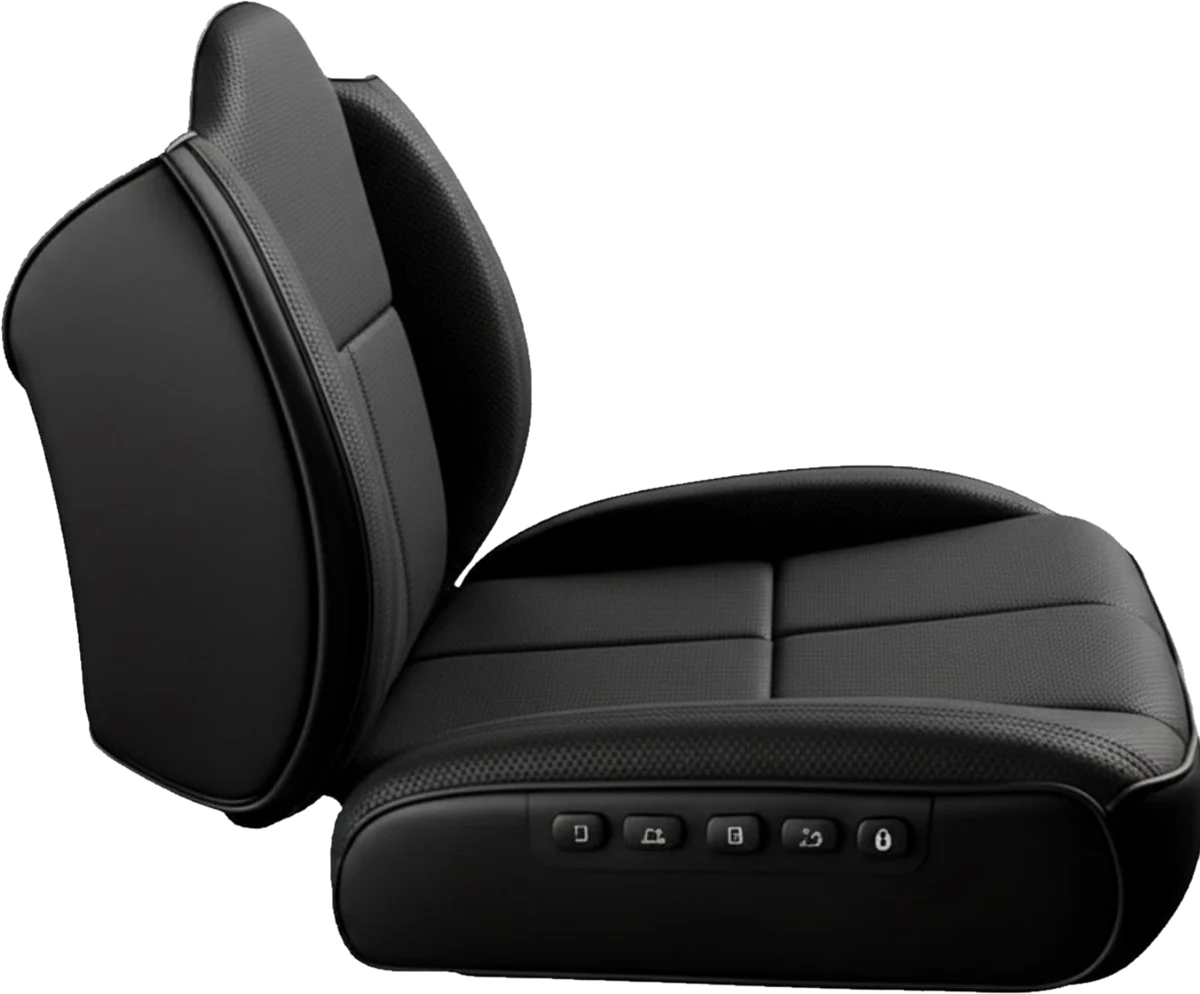
Black perforated leather and a quiet tone-on-tone wordmark keep Endura in Uber’s matte, minimal language, so it looks like part of the car. A sculpted backrest wraps the lower back, and a row of five buttons on the side of the cushion lets drivers adjust it without looking away from the road.
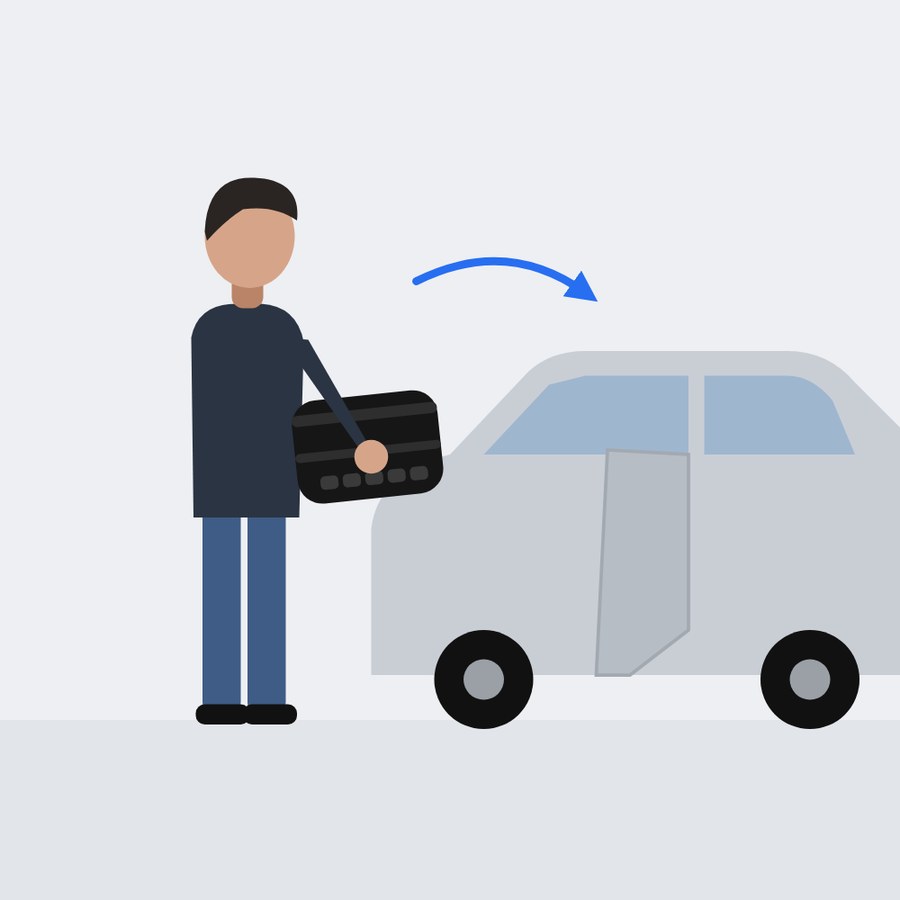
The seat cover folds up and moves with the driver from car to car.
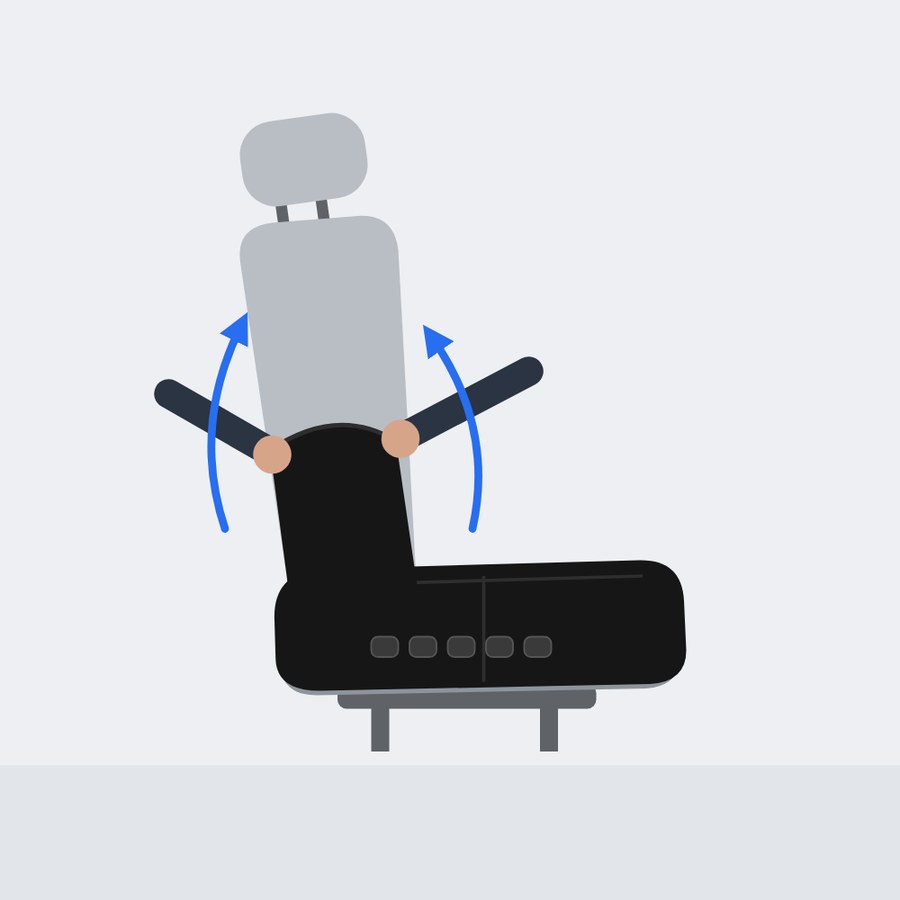
Slide the cover over the cushion and up the backrest.
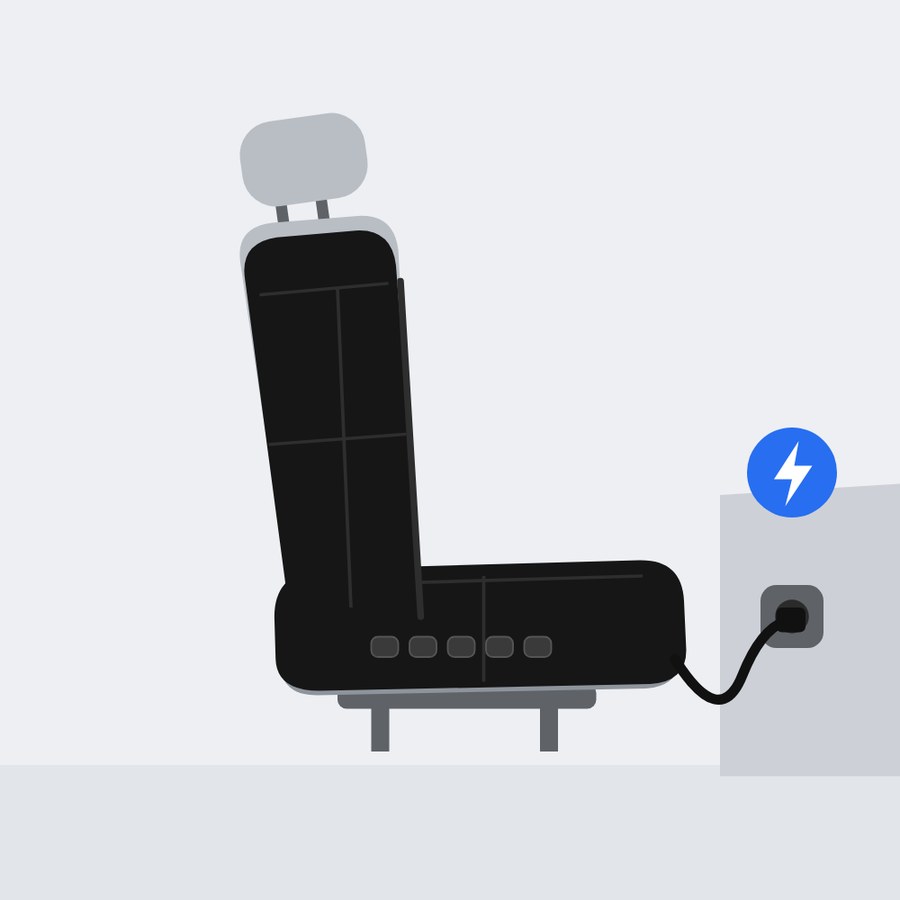
Connect the cushion to the car charger to charge it.
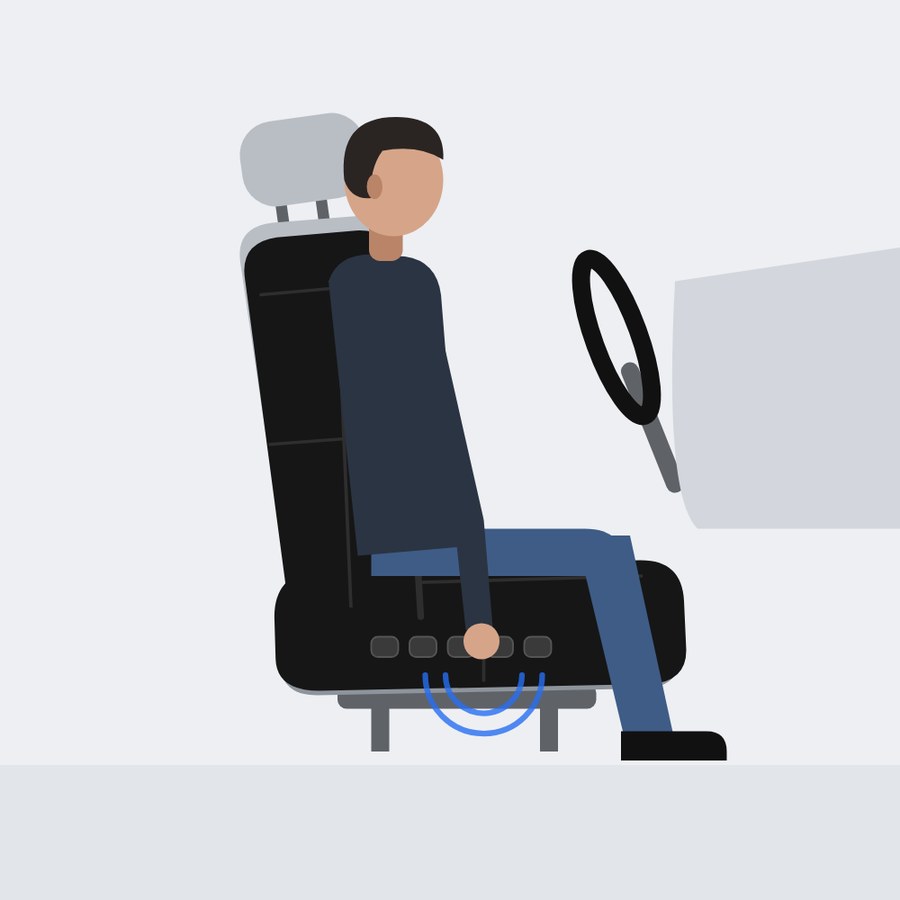
Use the buttons on the side, or let it readjust on its own.
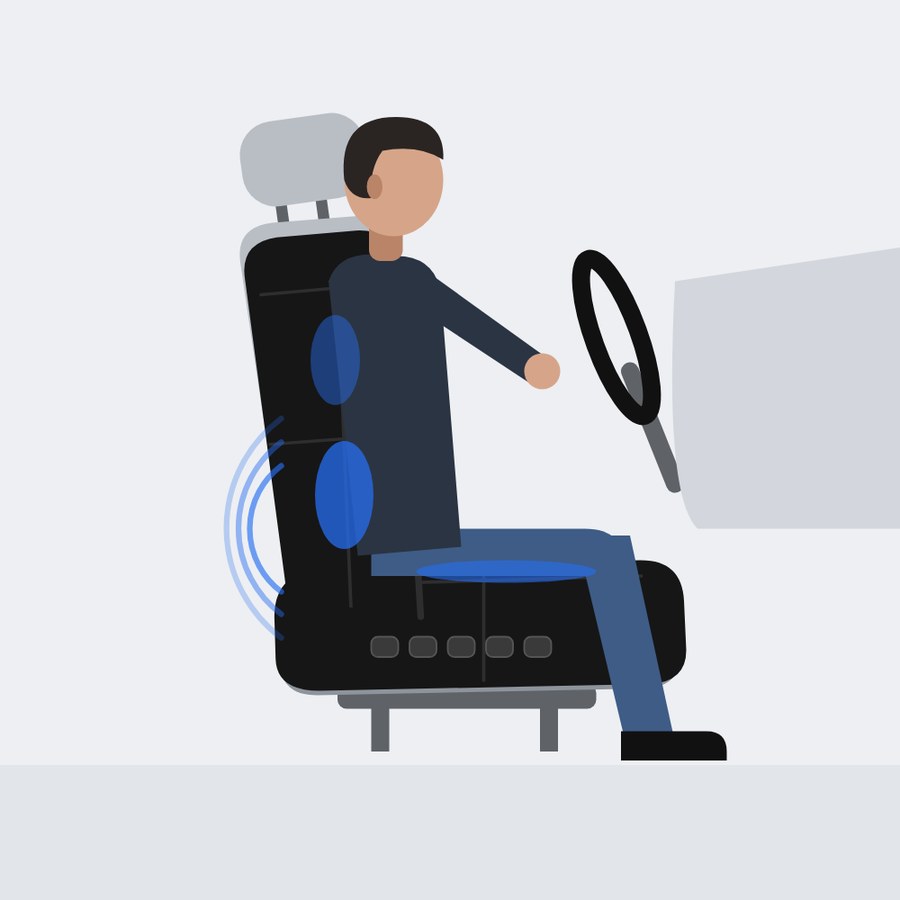
Zones inflate and massage to support the back and legs while you drive.
Turn the seat cover off when it’s not in use.
Feedback
Here’s what people said when they saw the final concept.
“It looks really professional and sleek. I can see how it would be a very helpful and easy to use product, because of how it slides over a seat.”
Decatur, GA
“Looks amazing! Very modern, minimalist, and it follows Uber’s aesthetic.”
Boston, MA
“As someone who just drove 8 hours and has considered Uber driving, I think this is a very well thought out invention for long-term drivers.”
Snellville, GA
“I drive Uber Eats and as someone who tries to take care of their physical health and stay in shape for soccer, this product would make driving a lot more worth it.”
Cambridge, MA
“This product seems very effective and useful for those that depend on driving as a way to make income, encompassing those with disabilities and reducing pressure sores or long-term damage linked to sitting in cars for long periods of time.”
Newnan, GA
Why Uber
Uber is in the right position to build this. It already has:
The driver’s body shouldn’t be the only part of the system that runs without maintenance.
What I learned
Case study · Fall 2025
An experiential city of student work.
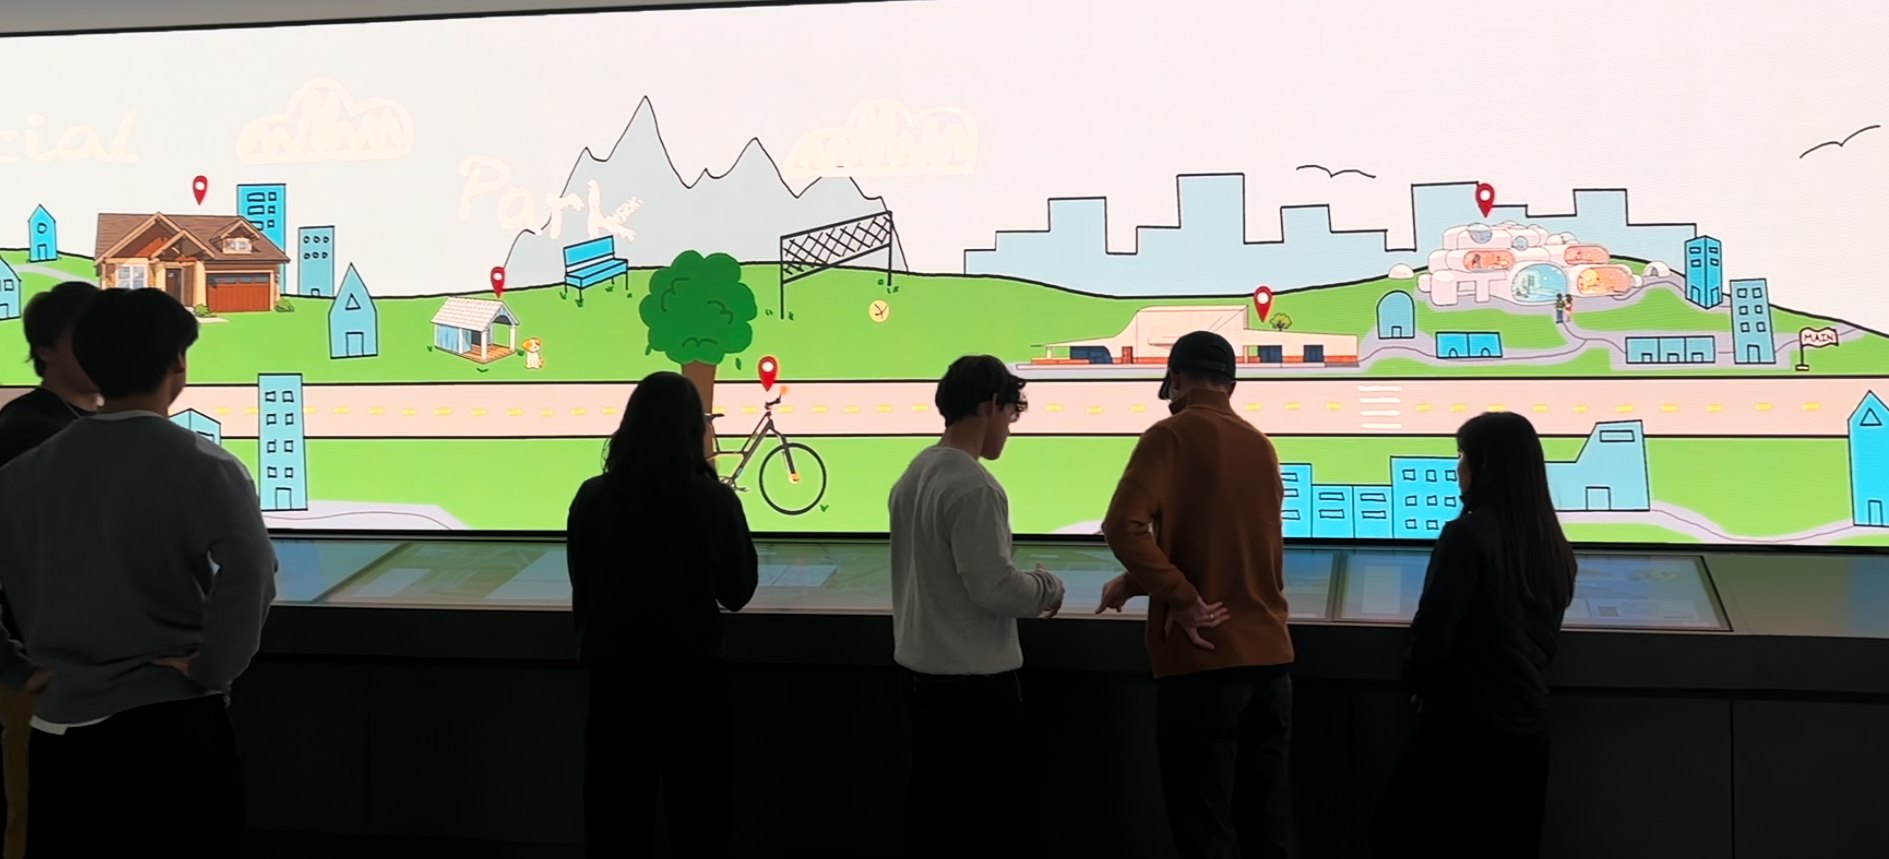
An interactive exhibit for the IMZ in Georgia Tech’s Price Gilbert Library. A College of Design city stretches across the curved LED wall, and touchscreen stations below it let visitors explore the student projects pinned on its map.
The brief
Most College of Design work lives in studios, process books and final reviews, so few people outside each school ever see it. Our goal was to fill the IMZ, a curved LED wall with touchscreen stations in Georgia Tech’s library, with a complete exhibit that anyone walking by could explore.
Process
Our first proposal was a Virtual CoD City Tour: a virtual city projected onto the back of the College of Design’s main staircase. Stepping into a spotlight, visitors could move through the city with hand gestures or let it play on its own, zooming in from a city planning project to architecture, building construction and industrial design, with music students’ soundtracks in the background.
The goal, through every version
Share work equally across every school in the college, and show how the disciplines connect.
From there, the project evolved in six stages. We moved it from the atrium to the IMZ, shifted from a guided virtual tour to a city visitors explore at their own pace, and refined the look from realistic renders to a hand-drawn sketchbook style.
Milestone 1
We mapped how people would move through the city, either on a guided tour that stops at each location or exploring on their own, then wireframed each path and explored three visual directions.
Based on the user flow, we wireframed each direction a visitor could take: following the tour path, the tour simulation itself, and self-guided exploration.
A glowing, metaverse-style city with dark neon colors, built around the innovative work CoD students make.
A less literal, cartoon-like city with big, clear buttons, where the real projects stand out from the drawn backgrounds.
Natural lighting and realistic renders, with filler buildings that make the city feel full and let the projects stand out.
Milestone 2
After sharing these directions and gathering feedback, we simplified the user flow and wireframes, explored how to highlight each project within the city, and designed a freestanding screen for the College of Design atrium.
Self-guided exploration became a simpler path: open the map, choose an area, and drop into the tour from there.
In the realistic direction, a white sketch line traced around each featured project so it would stand out from the realistic city around it. That idea of drawing attention to the projects themselves carried forward, but in the end we chose an illustrated, sketchy visual direction for the whole city instead of realistic renders.
A two-button console let visitors rotate and press to select places on the map, and switch their view of a project.
Milestone 3
The exhibit moved to the IMZ, a curved LED wall with ten touchscreens in the library. We tested three ways to use the space, each with a looping video on the big screen where outlines are sketched onto projects.
Each of the ten screens is a journey through one school’s projects.
Five pairs of screens: tap one to start a tour, watch it play on the other, with project info popping up on the wall.
A podium in the middle of the room lets people choose between five tours.
Milestone 4
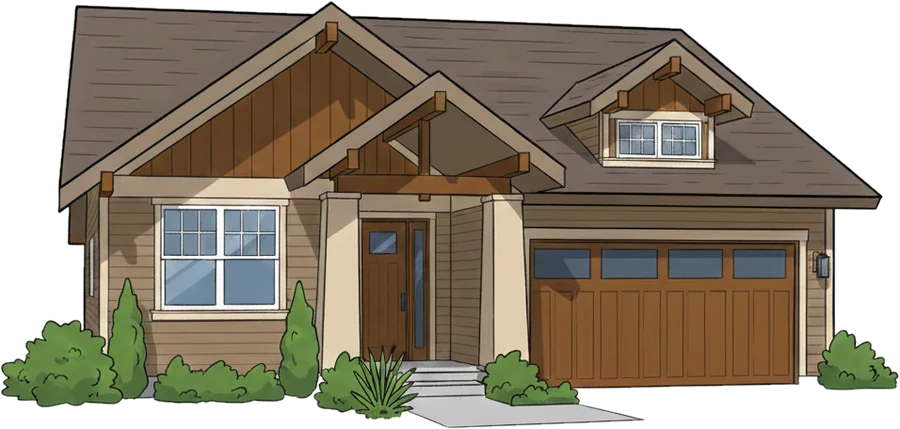
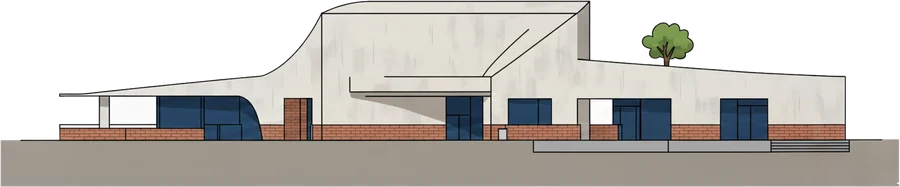
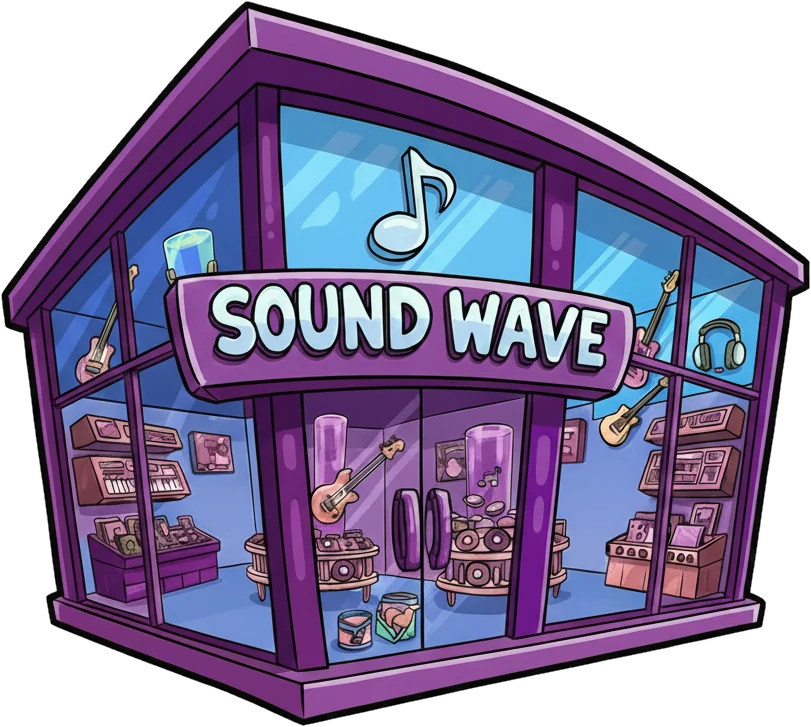
We organized the wall into four districts of a city: residential, park, commercial and downtown. Buildings in each district give context for the projects on the touchscreens below. In the commercial district, for example, a shoe store would sit on the big screen above a shoe designed by an industrial design major on the kiosk screen below.
Milestone 5
We built the first kiosk screens using a sample project, a wooden bath stool, to test the flow from “Touch to begin” to the project in context, its ideation and its final design.
With the screens taking shape, we went looking for student work to fill the city. We reached out to students in all five schools in the College of Design: industrial design, music technology, architecture, city and regional planning and building construction. For each project, we gathered existing project material: process books, images, models, renders, and videos.
Milestone 6
We drew the first full backdrop across the LED wall’s three screens. Included were the residential, park, shopping, downtown, and bridge regions, with “City Tour” titled in the middle. We built a working prototype of one kiosk touchscreen as well.
Video description: a prototype touchscreen loops a hand-drawn storefront with “Check this out,” then moves through a sample project’s overview, ideation sketches and final design screens.
For the final exhibit, I redrew the backdrop brighter and lighter so the projects would pop, and designed screens for all nine projects.
Final design
I drew the entire backdrop in Procreate. Each featured project got its own landmark on the map, marked with a red pin. Filler buildings, roads and hills tie them into one city. The bridge at the center carries the “College of Design City Tour” title.
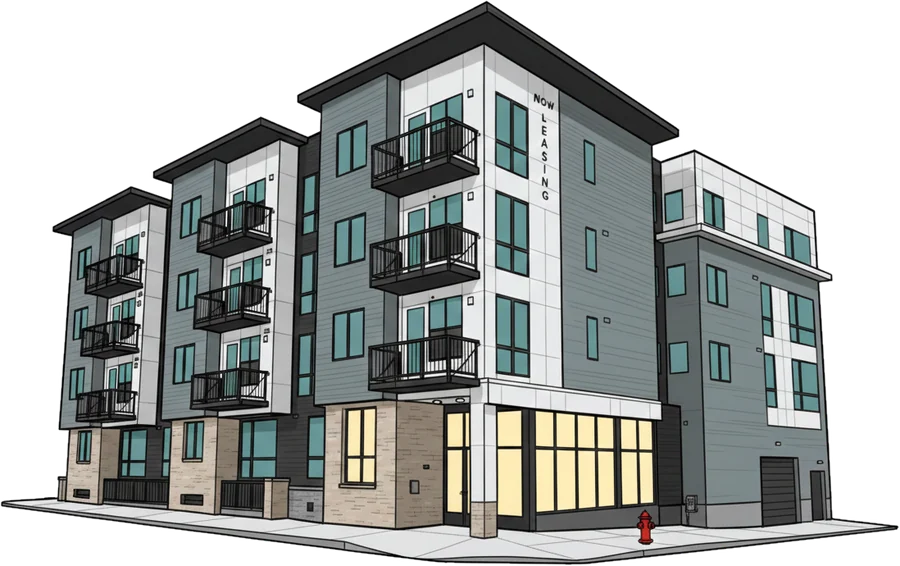
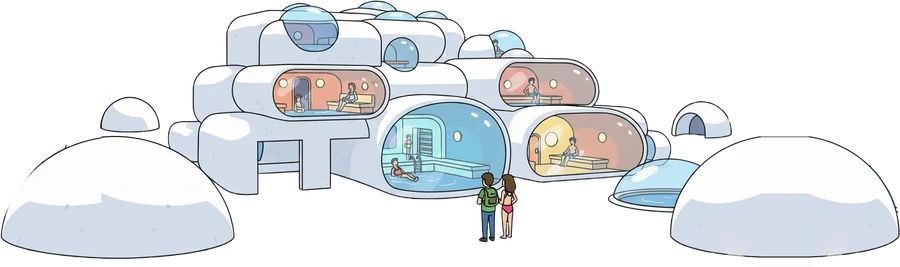
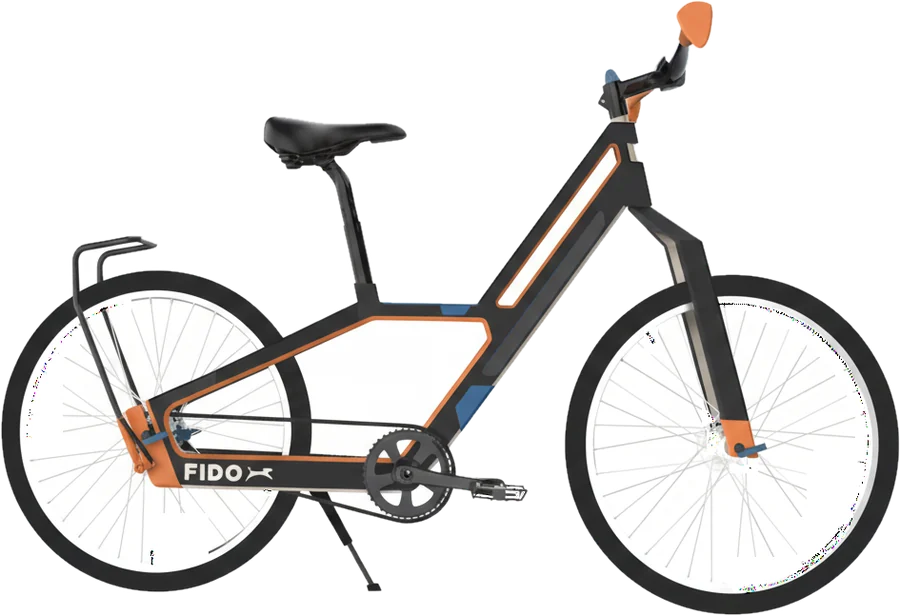
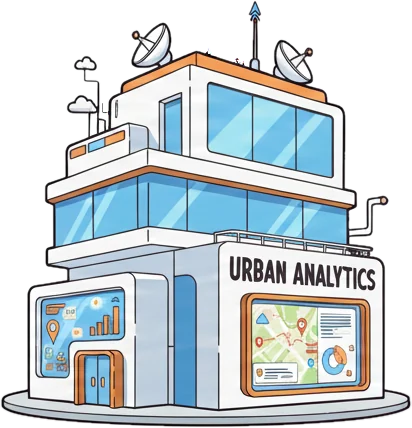
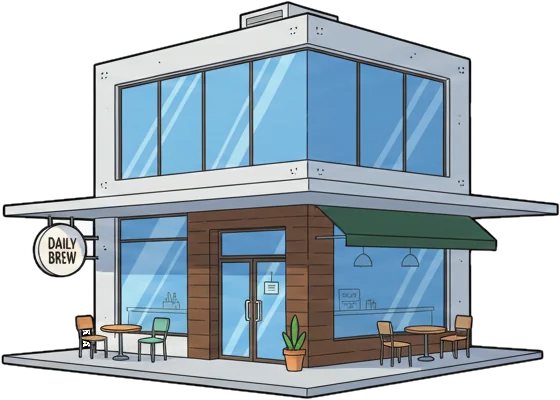
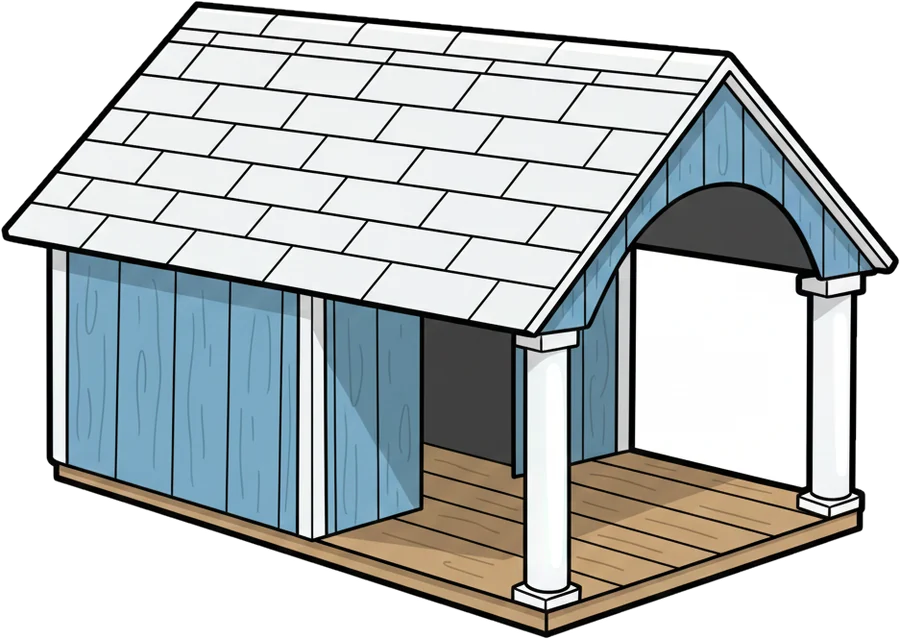
Ten touchscreens run along the base of the wall. The first introduces the experience and stays still; the other nine each belong to one project. I designed the screens for every project, in the same light, hand-drawn style as the wall above.
Each project plays out over five screens. For Capsule Collision, a bathhouse by Caleb Dortzbach, the station starts with a looping sketch of the building, then moves from the project overview to animated sections, concept sketches and physical models.
A looping hand-drawn sketch of the bathhouse invites visitors to tap in.
The title, class, prompt and designer.
An animated section cuts through the capsules.
Early sketches show how the capsules could intersect.
Cardboard, wood, 3D-printed and plaster models.
Two more projects, five screens each:
In the library
CoD City ran on the IMZ in Price Gilbert Library for our final review, and stayed up through the end of the fall 2025 semester and into spring 2026. The backdrop looped across the wall while visitors stepped up to the stations to explore each project.
Video description: visitors walk along the curved IMZ wall showing the hand-drawn CoD City backdrop, tap through project screens at the touch stations, and the camera closes in on the bridge with the “City Tour” title.
What I learned
Case study · Summer 2026
Designer Intern · NS1 Connect · IBM Software
Four projects from my summer on NS1 Connect, IBM’s platform for managing DNS and steering internet traffic. Much of this work is under NDA, so I share it at a high level.
01
I evaluated NS1 Connect from end to end against Nielsen’s 10 usability heuristics, working through 26 flows across eight areas of the product, and presented what I found to the NS1 Connect design team.
Approach
I went through NS1 Connect the way a new customer would, starting with Getting Started and then following the navigation bar. For every flow, I captured each screen, annotated what I noticed, and rated the flow against each of Nielsen’s 10 heuristics.
Green, yellow and red rate each heuristic. Purple and blue flag specific moments on the screens themselves: a bug, or something I couldn’t make sense of as a user.
Scorecard
Every flow, rated against every heuristic. Read across a row to see how one flow did, or down a column to see how one heuristic held up across the product.
| Flow | Visibility of system status | Match between system and real world | User control and freedom | Consistency and standards | Error prevention | Recognition rather than recall | Flexibility and efficiency of use | Aesthetic and minimalist design | Help users diagnose and recover from errors | Help and documentation |
|---|---|---|---|---|---|---|---|---|---|---|
| Getting Started | ||||||||||
| Welcome to NS1 Connect | Good | Good | Minor usability issue | Good | Minor usability issue | Good | Minor usability issue | Good | Minor usability issue | Good |
| Initial setup 1 (log-out error) | Minor usability issue | Minor usability issue | Major usability issue | Good | Major usability issue | Minor usability issue | Minor usability issue | Good | Major usability issue | Minor usability issue |
| Initial setup 1 (round 2) | Good | Minor usability issue | Minor usability issue | Good | Good | Good | Minor usability issue | Good | Minor usability issue | Minor usability issue |
| Initial setup 2 | Good | Minor usability issue | Minor usability issue | Good | Minor usability issue | Minor usability issue | Minor usability issue | Good | Minor usability issue | Minor usability issue |
| Initial setup 3 | Minor usability issue | Minor usability issue | Major usability issue | Good | Minor usability issue | Major usability issue | Major usability issue | Minor usability issue | Minor usability issue | Minor usability issue |
| Initial setup 3 (toggles) | Minor usability issue | Minor usability issue | Minor usability issue | Major usability issue | Good | Major usability issue | Good | Good | Major usability issue | Minor usability issue |
| Initial setup 4 | Good | Minor usability issue | Minor usability issue | Good | Good | Minor usability issue | Minor usability issue | Good | Minor usability issue | Minor usability issue |
| Create an API key | Minor usability issue | Minor usability issue | Minor usability issue | Major usability issue | Minor usability issue | Minor usability issue | Minor usability issue | Good | Minor usability issue | Minor usability issue |
| Create a monitoring job | Minor usability issue | Minor usability issue | Minor usability issue | Good | Minor usability issue | Minor usability issue | Major usability issue | Good | Major usability issue | Minor usability issue |
| Integrations and premium add-ons | Good | Good | Minor usability issue | Good | Minor usability issue | Good | Minor usability issue | Good | Minor usability issue | Good |
| Dashboard | ||||||||||
| Dashboard page | Good | Minor usability issue | Minor usability issue | Good | Good | Good | Minor usability issue | Good | Minor usability issue | Minor usability issue |
| Sync to Route 53 | Minor usability issue | Good | Minor usability issue | Minor usability issue | Good | Minor usability issue | Good | Good | Good | Minor usability issue |
| Sync to NS1 Connect | Good | Minor usability issue | Major usability issue | Major usability issue | Minor usability issue | Minor usability issue | Minor usability issue | Good | Major usability issue | Minor usability issue |
| DNS | ||||||||||
| Zones | Good | Minor usability issue | Minor usability issue | Minor usability issue | Minor usability issue | Minor usability issue | Minor usability issue | Good | Major usability issue | Minor usability issue |
| Networks | Good | Minor usability issue | Minor usability issue | Good | Good | Minor usability issue | Minor usability issue | Good | Good | Minor usability issue |
| Redirects | ||||||||||
| Source and target URLs | Minor usability issue | Good | Minor usability issue | Major usability issue | Good | Minor usability issue | Minor usability issue | Good | Minor usability issue | Minor usability issue |
| SSL/TLS certificates | Good | Minor usability issue | Minor usability issue | Good | Good | Minor usability issue | Minor usability issue | Good | Minor usability issue | Minor usability issue |
| Observability | ||||||||||
| Activity log | Good | Minor usability issue | Good | Good | Good | Good | Minor usability issue | Good | Minor usability issue | Minor usability issue |
| Scheduled reports | Good | Good | Minor usability issue | Minor usability issue | Good | Good | Good | Good | Minor usability issue | Good |
| Data sets | Minor usability issue | Minor usability issue | Good | Minor usability issue | Minor usability issue | Good | Good | Good | Minor usability issue | Good |
| Monitors | ||||||||||
| Monitoring | Good | Minor usability issue | Good | Good | Minor usability issue | Good | Minor usability issue | Good | Minor usability issue | Minor usability issue |
| Integrations | ||||||||||
| Data sources | Good | Minor usability issue | Good | Minor usability issue | Good | Minor usability issue | Minor usability issue | Good | Minor usability issue | Good |
| Feeds | Good | Good | Good | Minor usability issue | Minor usability issue | Good | Good | Good | Minor usability issue | Good |
| Additional integrations | Minor usability issue | Minor usability issue | Minor usability issue | Good | Good | Good | Minor usability issue | Good | Good | Good |
| Alerts | ||||||||||
| Notifier lists | Good | Minor usability issue | Minor usability issue | Minor usability issue | Minor usability issue | Good | Good | Good | Minor usability issue | Minor usability issue |
| Alerts | Good | Good | Good | Good | Minor usability issue | Good | Minor usability issue | Good | Good | Good |
Aesthetic and minimalist design was the clear strength, rated good in 25 of 26 flows. Helping users diagnose and recover from errors was the weakest, with the most major issues and only four good ratings.
Walkthrough
In navigation order, here’s what stood out in each area, with my annotated screens. Select an image to see it larger.
1
The guided setup tutorial for new customers.
The early steps are guided and clear. Complexity climbs in the middle, the toggles and tutorial break down from inconsistency and a lack of clarity, and the final steps are clean but don’t say what to do next.
2
The home page, with DNS queries, traffic and health at a glance.
The dashboard shows traffic over time well, but unclear labels and technical terms make it hard to tell what each network represents or how to read the data.
3
Where customers manage zones, records and networks.
Powerful and clearly laid out, but with a steep learning curve. How records, filters and traffic connect is unclear, and when something breaks it isn’t obvious why.
4
URL redirect rules, and the SSL/TLS certificates that secure them.
There’s no consistent add or save button, and after deleting a record I was sent back to the list instead of the edit page.
5
The activity log, scheduled reports and data sets.
The activity log is clear, efficient and transparent, but it lacks the filtering and context to fully support an investigation.
6
Tracks the health and availability of endpoints, like websites and APIs.
Strong green and red status indicators, but terms like job setup, checks and conditions need interpreting, and root causes aren’t always obvious.
7
Connects external services like Datadog, ThousandEyes and AWS to bring data into NS1.
A strong entry point to documentation that would be even more useful with empty-state guidance, clearer actions for adding an integration, and inline explanations for setup fields.
8
Notifier lists and the alerts that use them.
One of the strongest areas: alerts are intuitive, with clear confirmation feedback. Notifier lists could use light guidance on how they connect to alerts.
Key takeaways
Plain-language explanations and relationship cues: “This does X, which affects Y.”
Descriptions for filters and toggles, and notes like “This option is hidden because X is enabled.”
Next-step calls to action, use-case guidance, and templates or presets.
Consistent save, add and edit buttons, modal and side-panel behavior, and navigation.
Shift from “Error” to “This failed because X. Try Y.”
More tooltips, contextual help in the interface, and examples.
NS1 Connect is powerful and visually well structured, but it relies heavily on user expertise. Clearer system behavior, relationships and guidance would help users understand why, not just what.
I presented the evaluation to the NS1 Connect design team at the end of the two weeks.
02
I led the integration of the IBM Ideas Portal into the onboarding experience of NS1 Connect, making customer feedback channels more visible and accessible to drive engagement and product innovation. It’s now live in NS1 Connect!
Background & problem
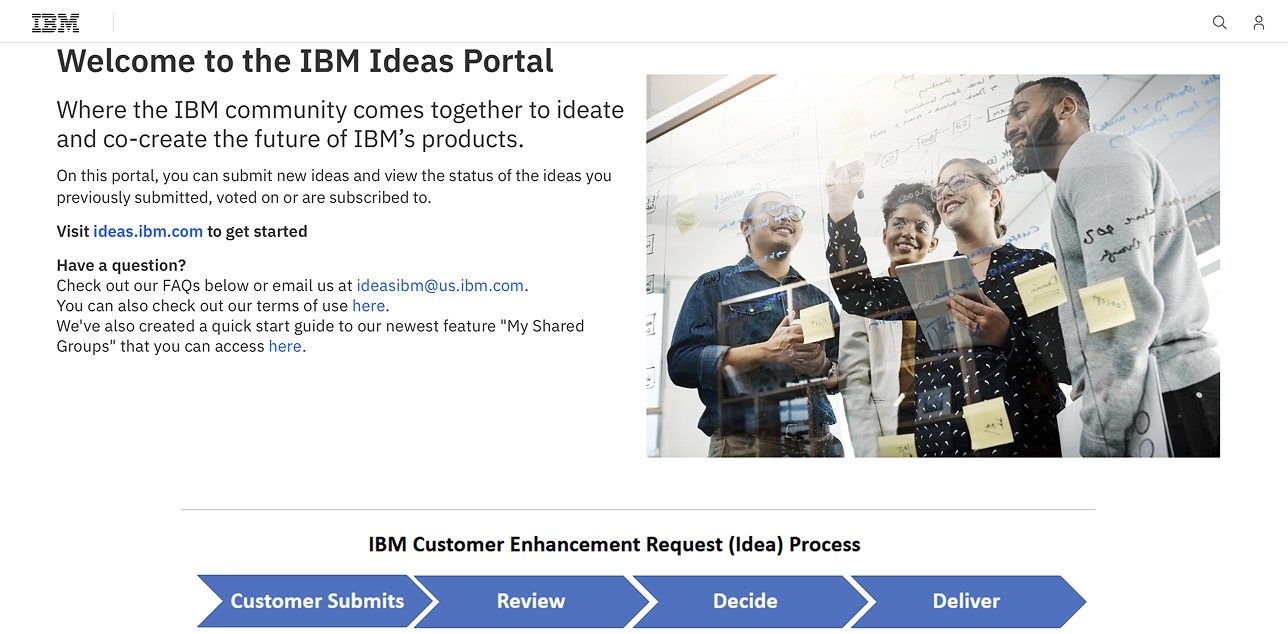
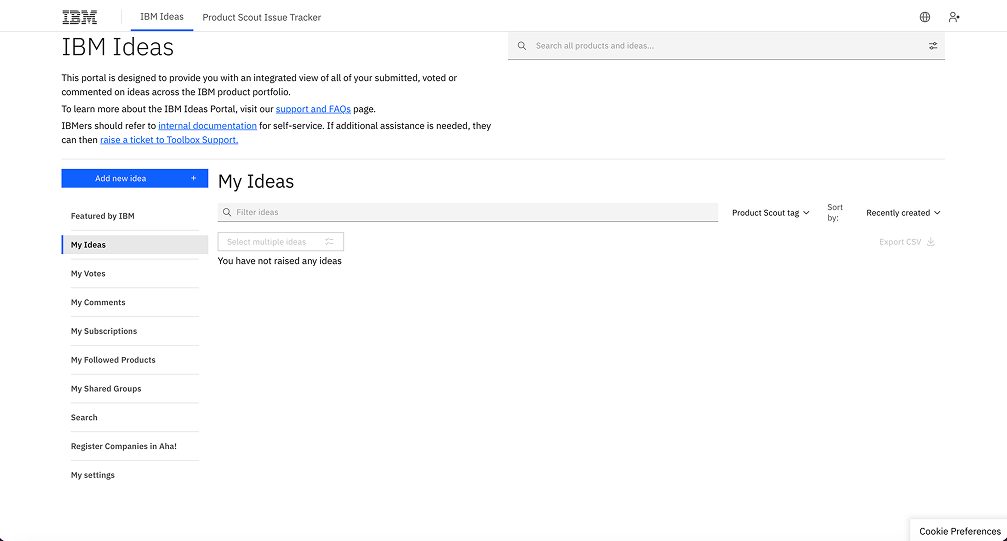
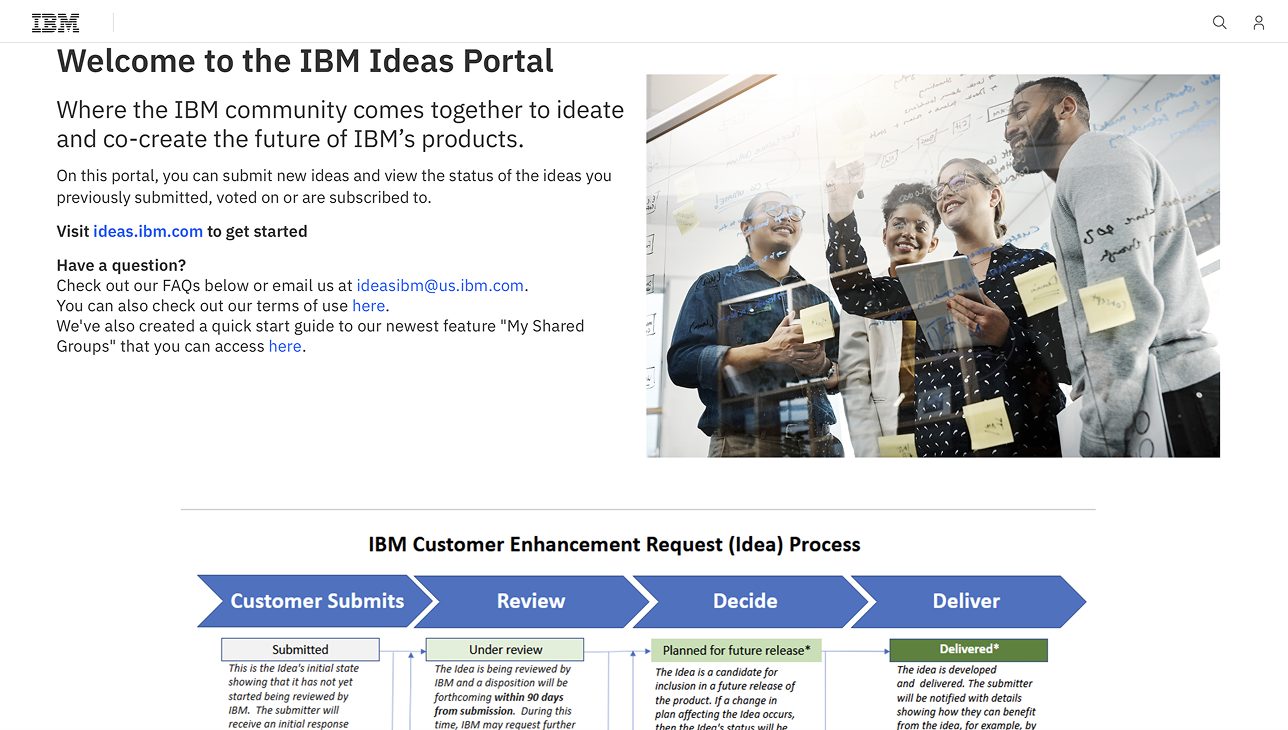
The IBM Ideas Portal is where customers submit feature requests and vote on other people’s ideas. The ideas go through IBM’s review process, and it’s how product teams hear directly from the people using their products.
NS1 Connect and the Ideas Portal weren’t linked, so a customer with an idea had to already know the portal existed and find it on their own. This led to a lot of useful feedback never being heard.
Product teams need a steady stream of customer feedback to decide what to build next.
The Ideas Portal already exists, and it already routes ideas to the right product managers.
Put a link to it where NS1 Connect customers already are.
Discovery & research

Persona
Network administrator · Platform operator
Manages DNS in NS1 Connect every day and knows what’s missing, but doesn’t know how to share his feedback.
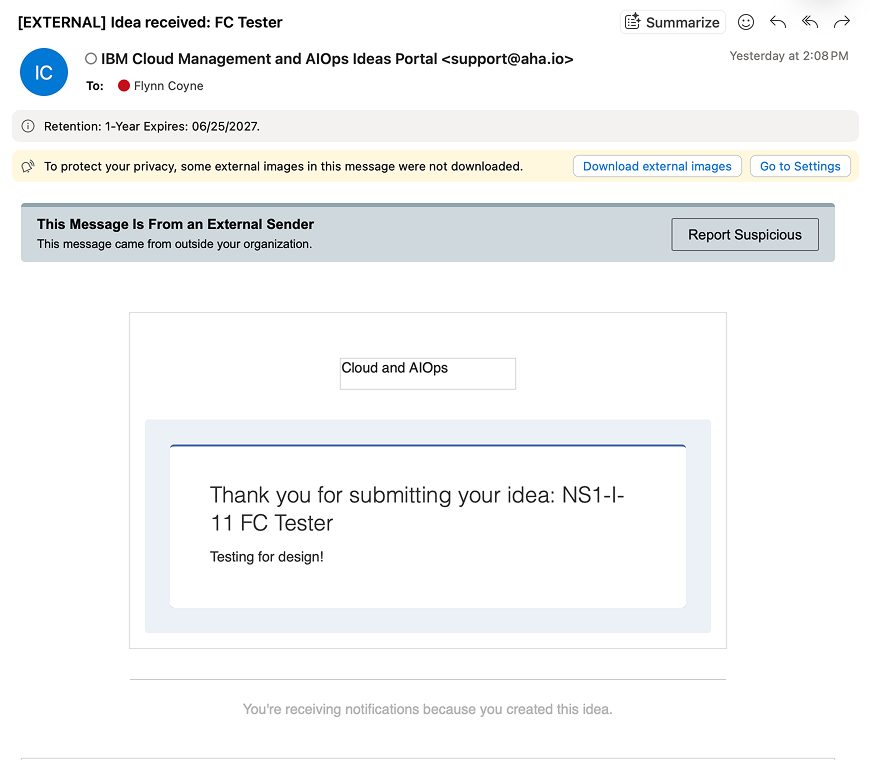
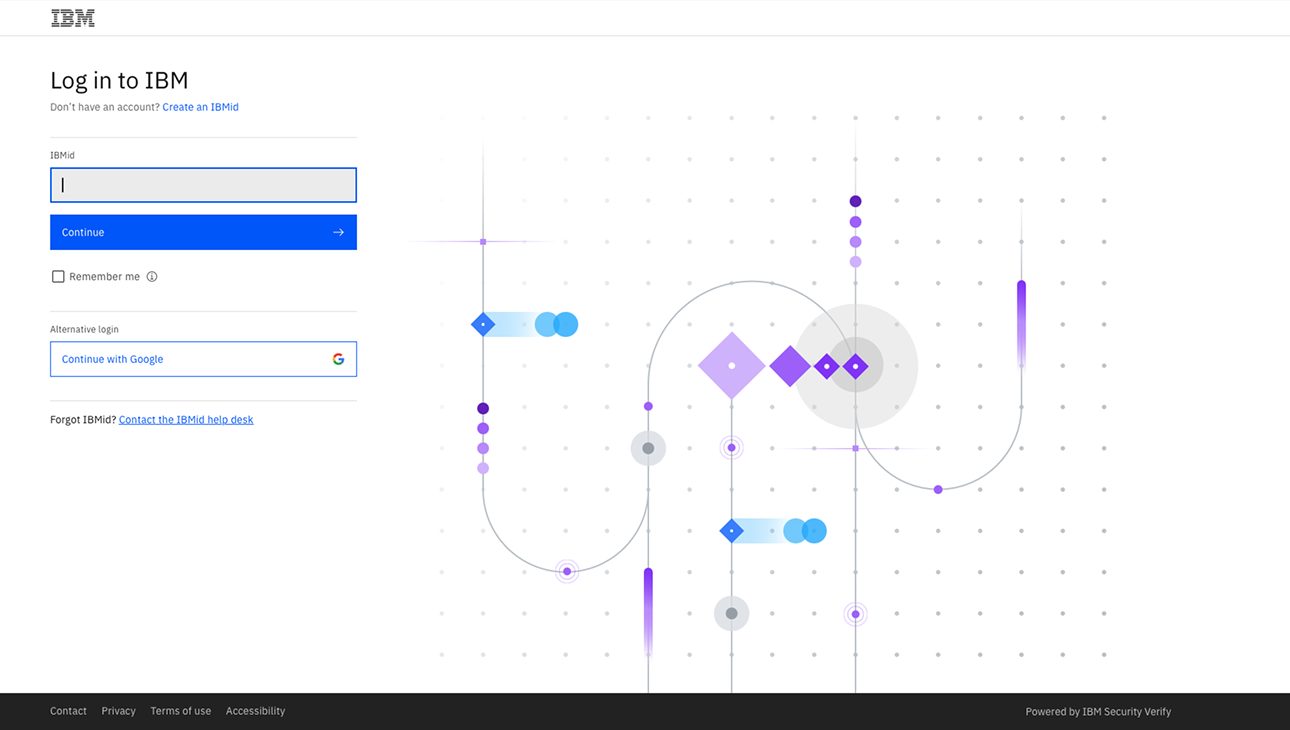
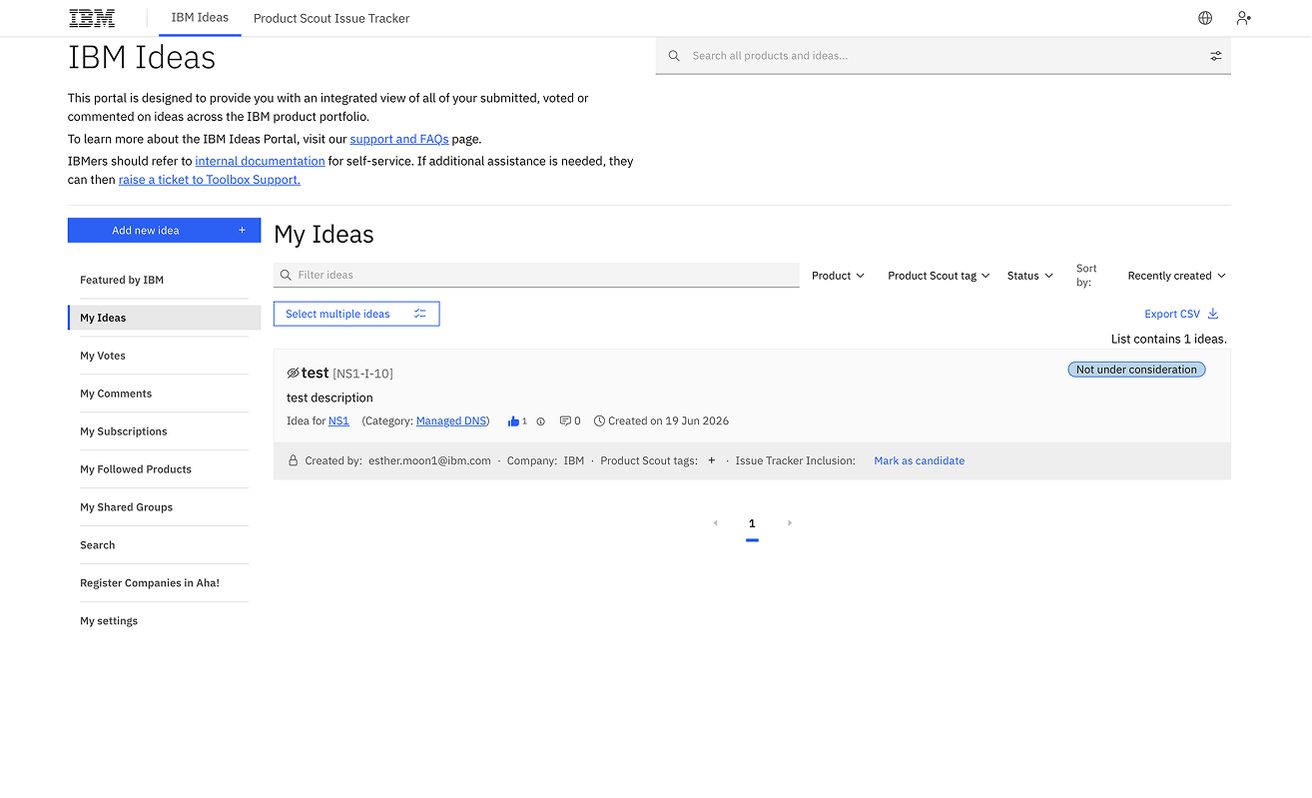
To see what someone like Jordan goes through, I walked the current experience end to end: from NS1 Connect to the portal, through IBM sign-in, to submitting a test idea and waiting for a reply.
Stakeholder input
We ran a brain-dump session with product management to capture what they needed from the integration. A few notes set the direction.
“Project management just wants a link.”
“Link after Getting Started. Somewhere permanent as well.”
“We would prefer if some ideas were filtered through the Ideas Portal, in case there are duplicates.”
“We’re navigating towards a left-side navigation system in the future.”
That gave us our criteria: a simple link, in a permanent place customers see early, that still works when the navigation moves.
Exploration
Going through NS1 Connect, we found four places a customer might look for help or a way to give feedback.
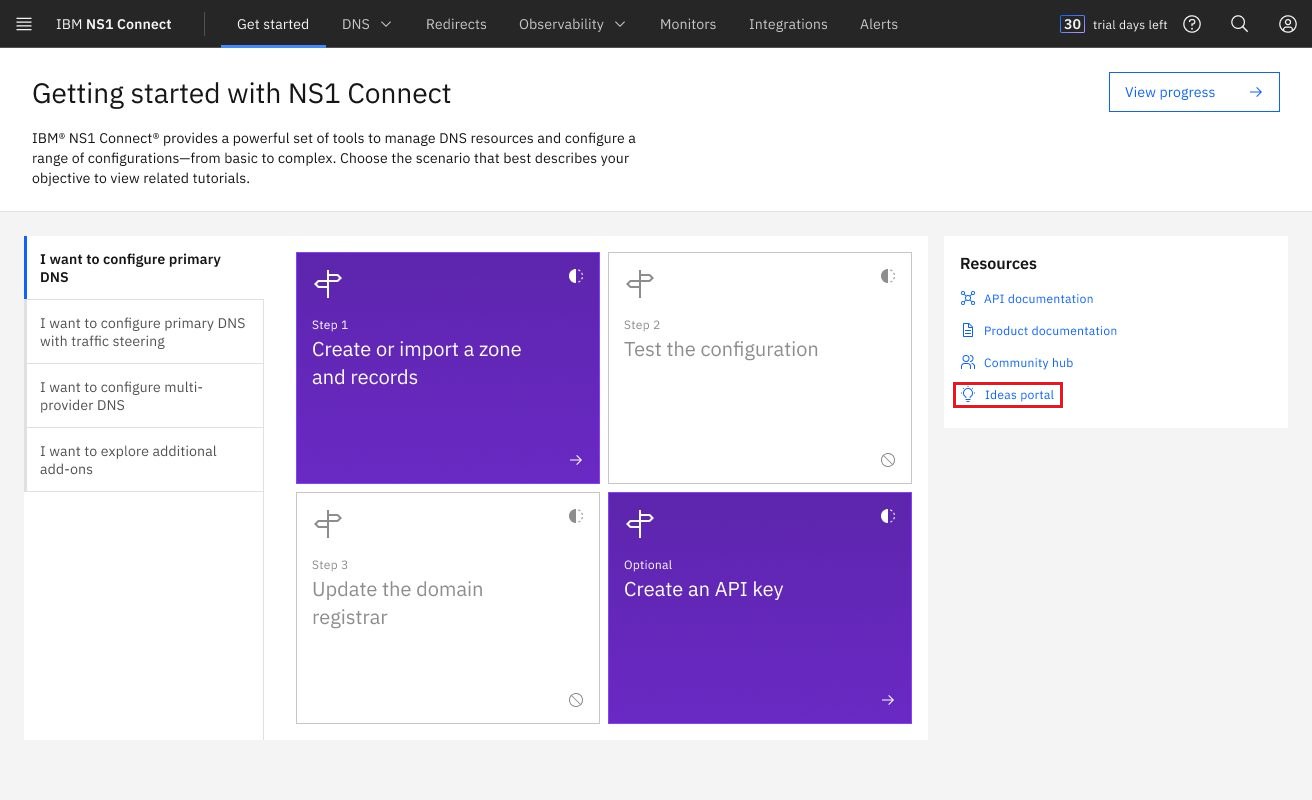
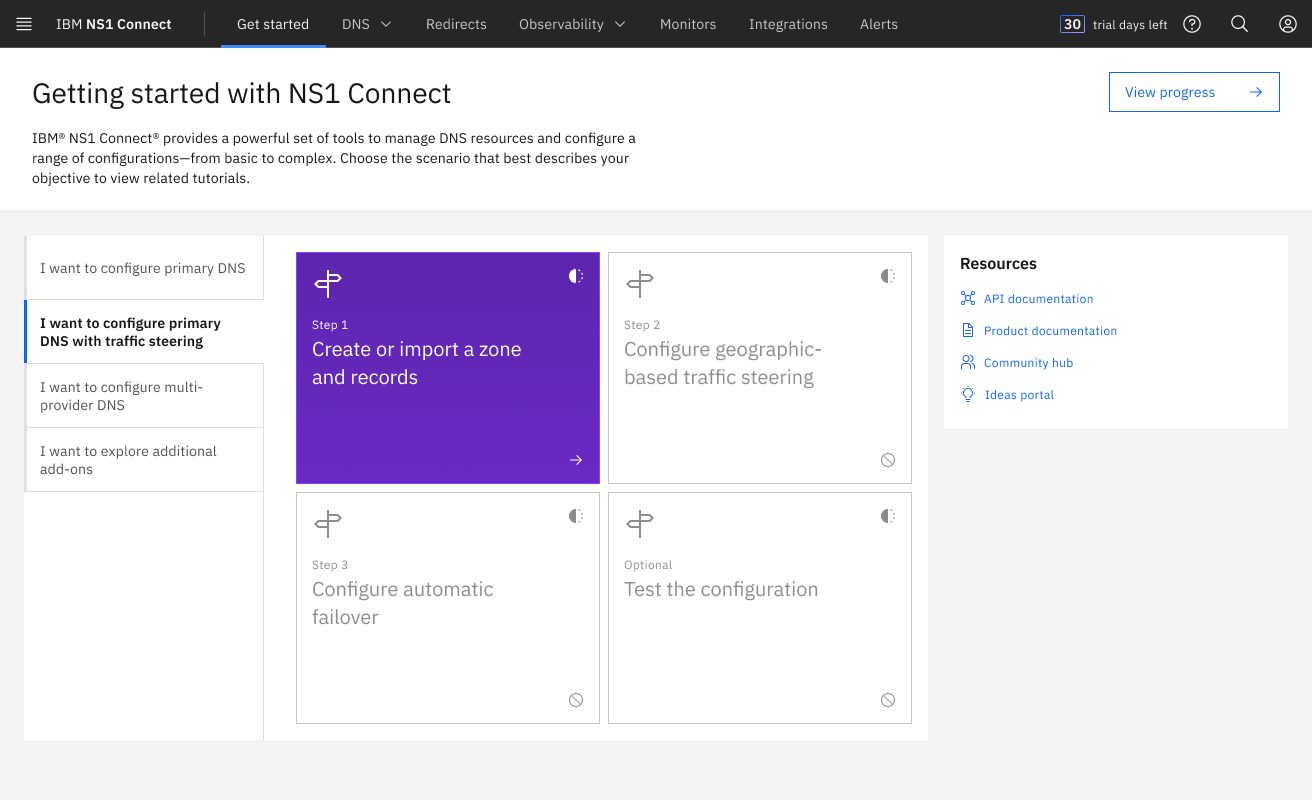
The first page new customers use, with a list of resources beside the setup steps.
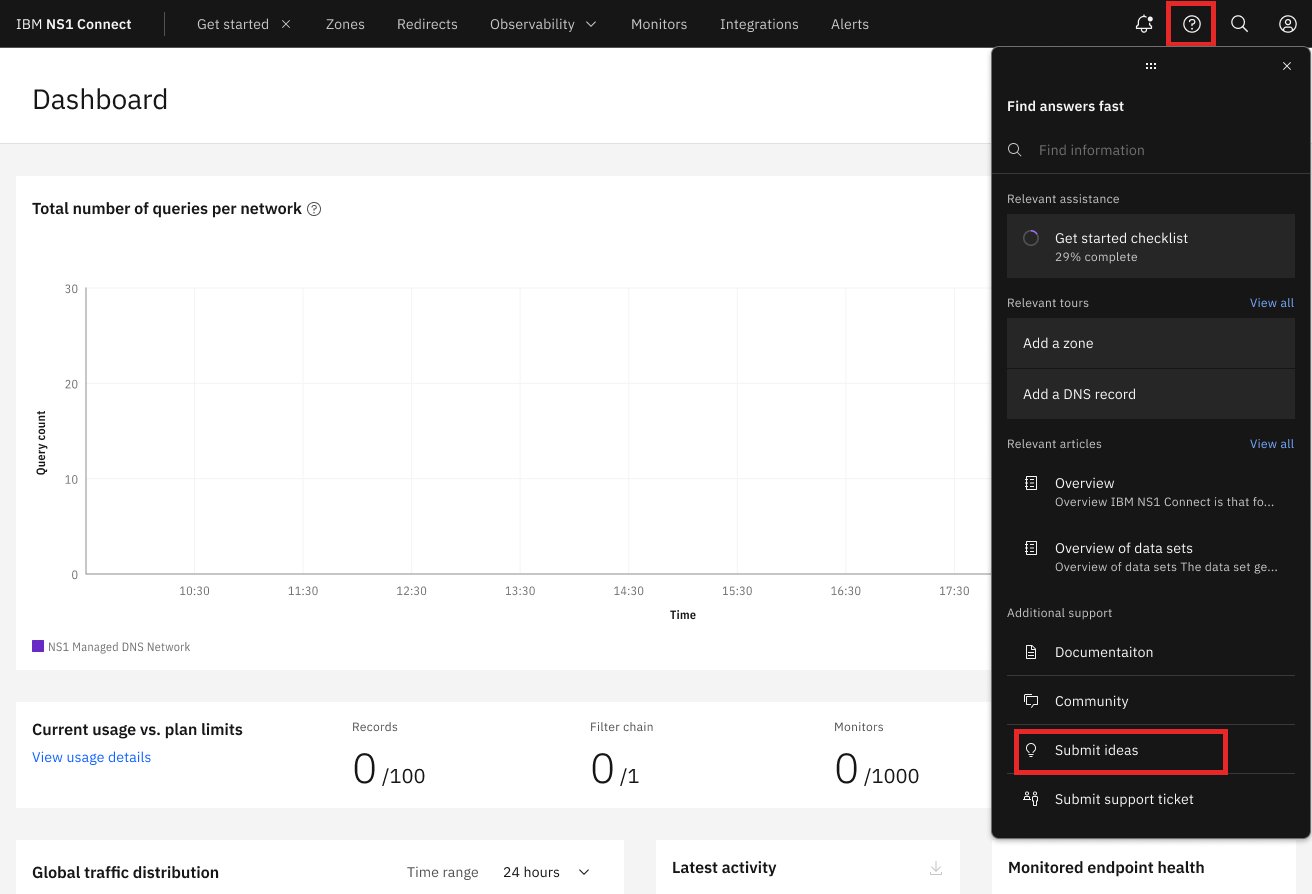
The “Search help” side panel, with its other support links.
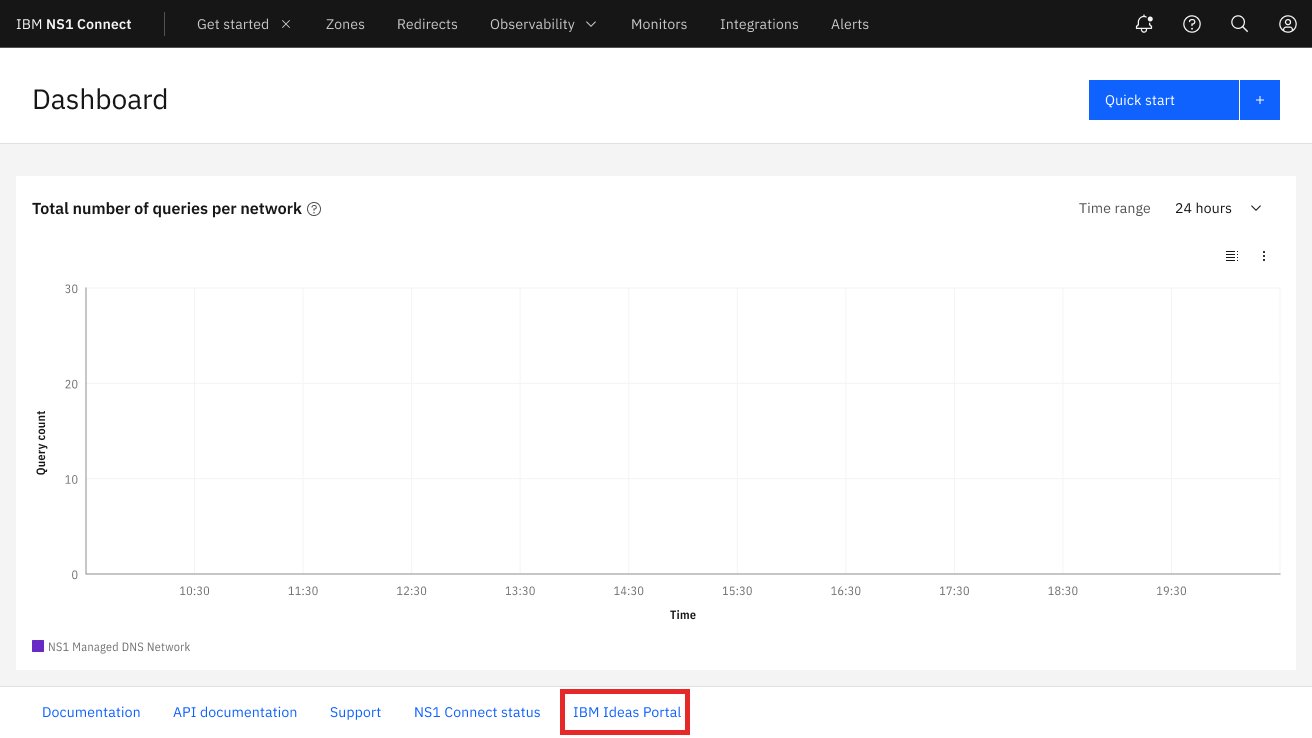
Next to Contact Support and NS1 Status, links that already open external pages.
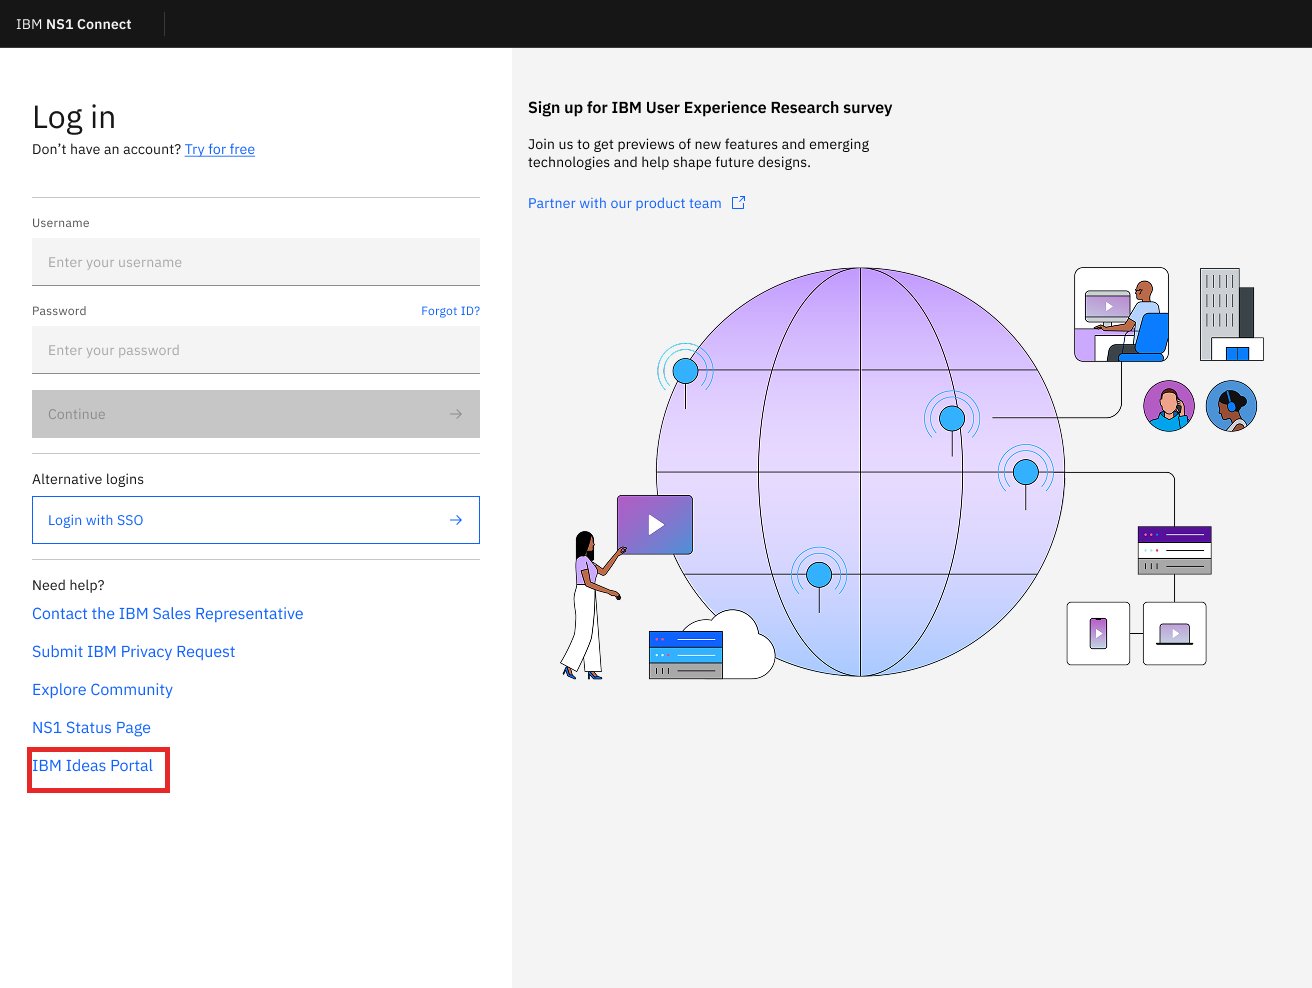
The “Need help?” links, before a customer even signs in.
I found opportunity for engagement in the Getting Started page, so I began to ideate within that sphere.
My solution
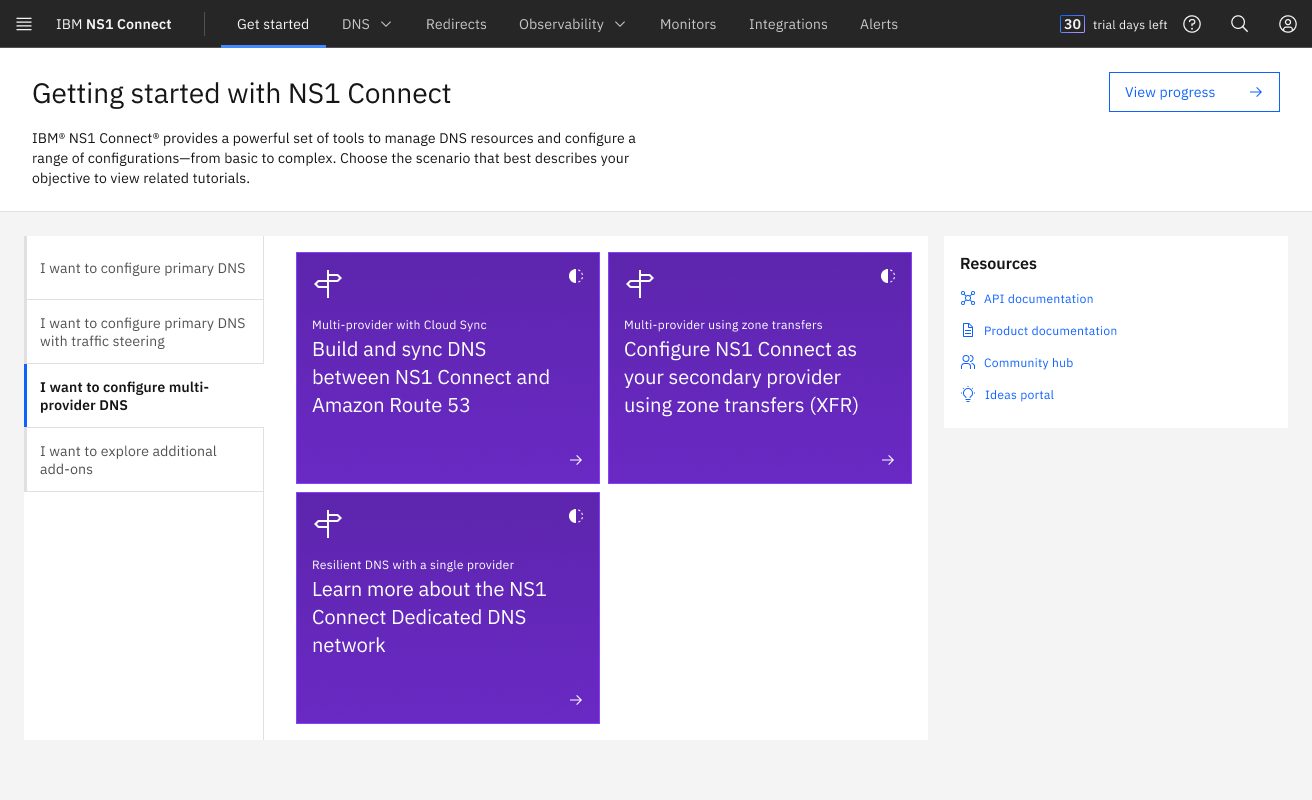
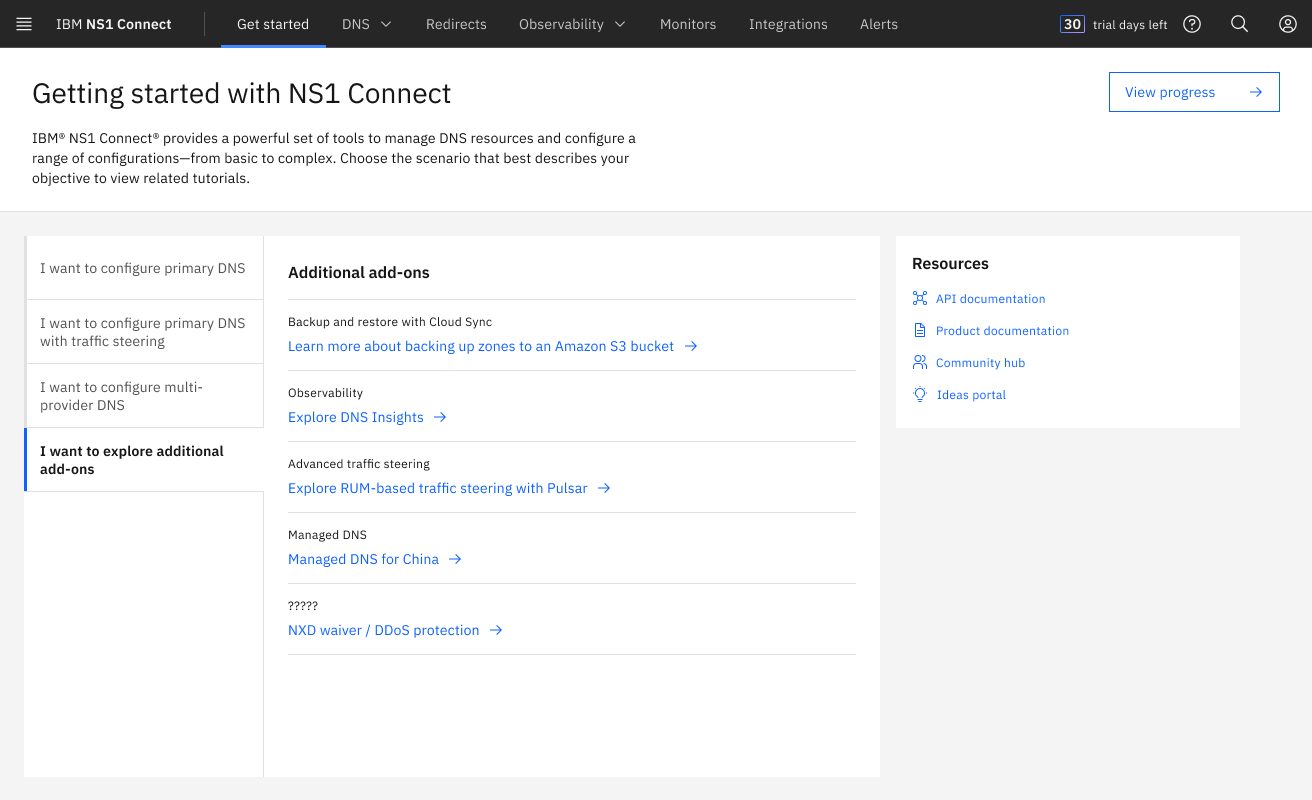
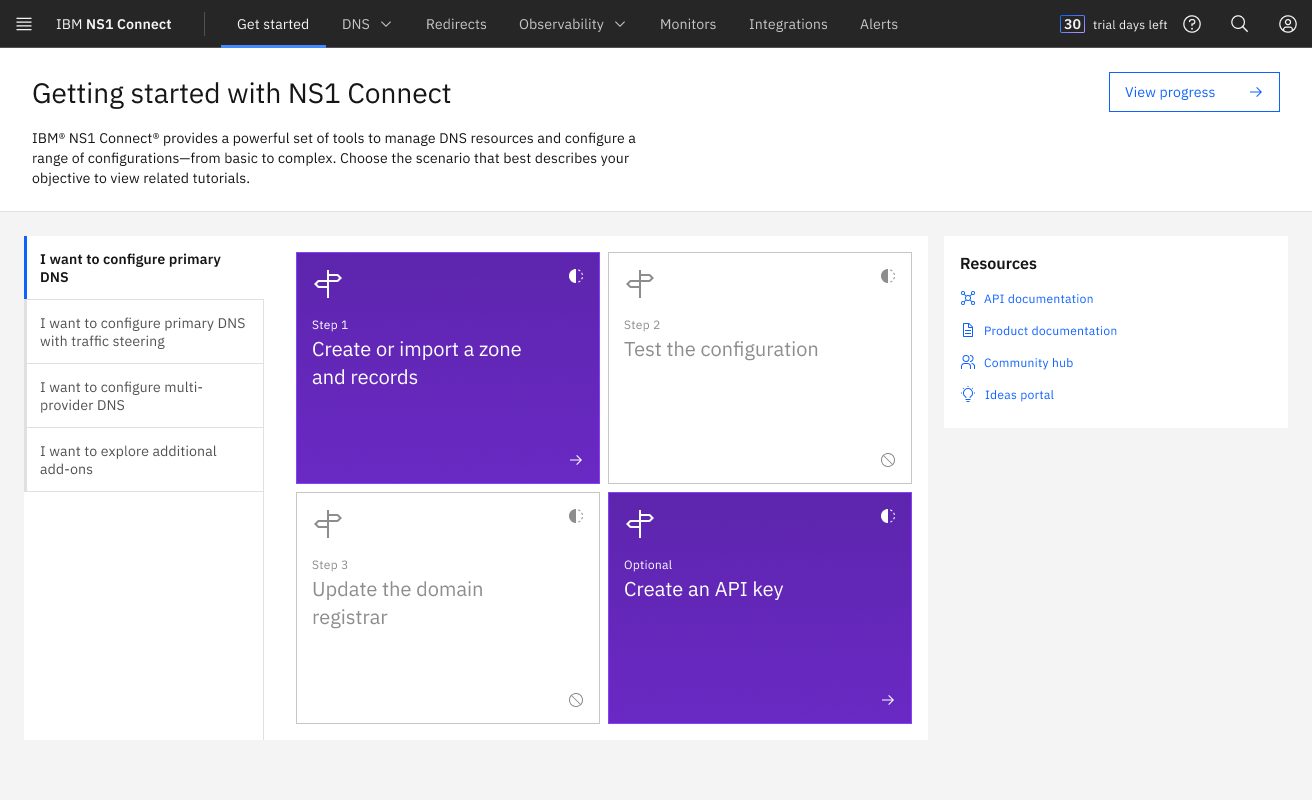
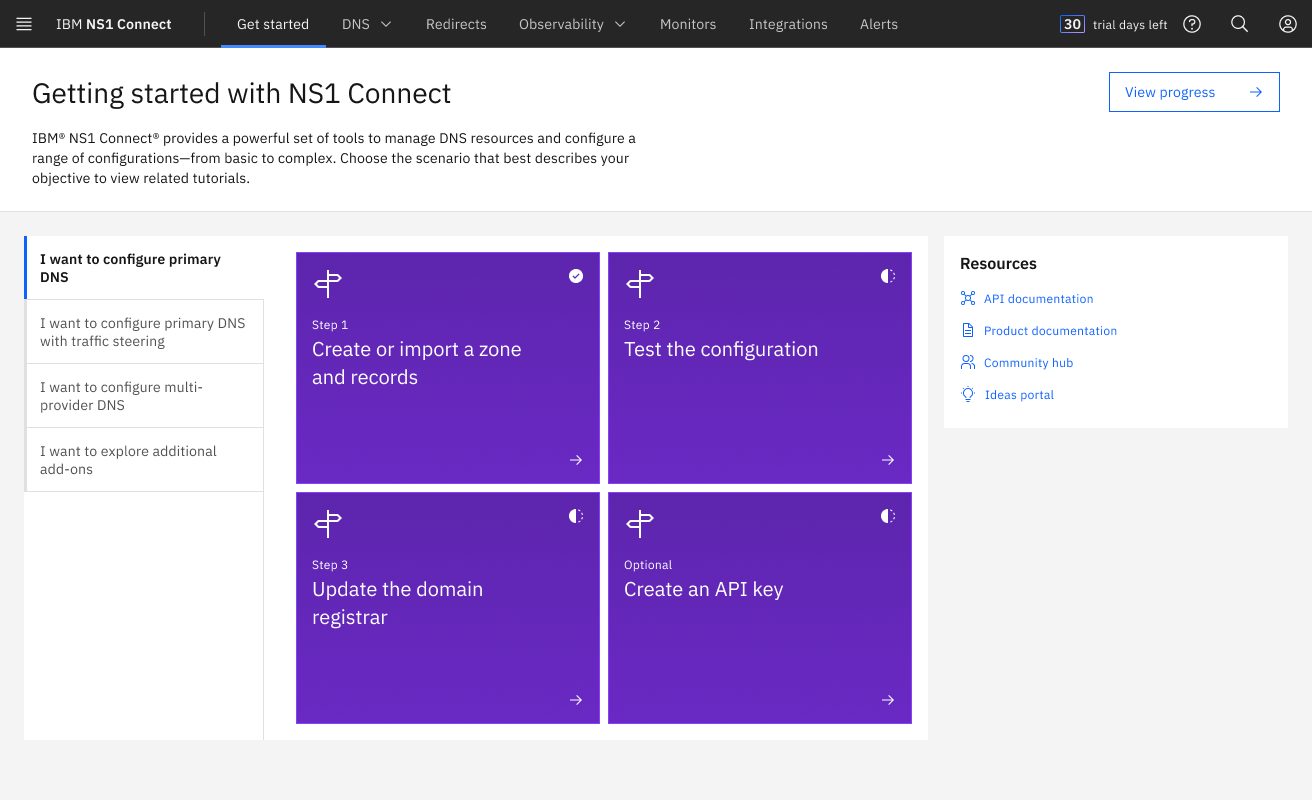
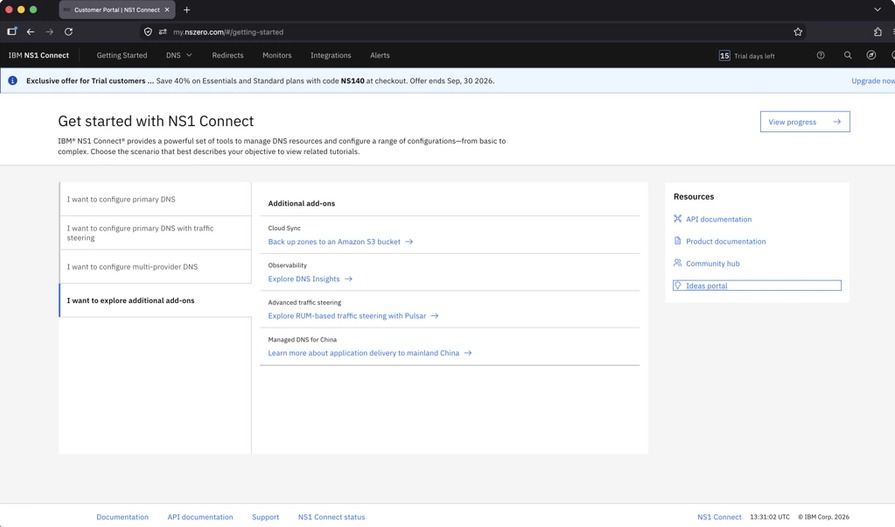
Getting Started is where new NS1 Connect customers begin setting up their account. I added “Ideas portal” to the Resources list alongside API documentation, product documentation and the community hub. The link is there from the start, so users can easily return to it in the future.
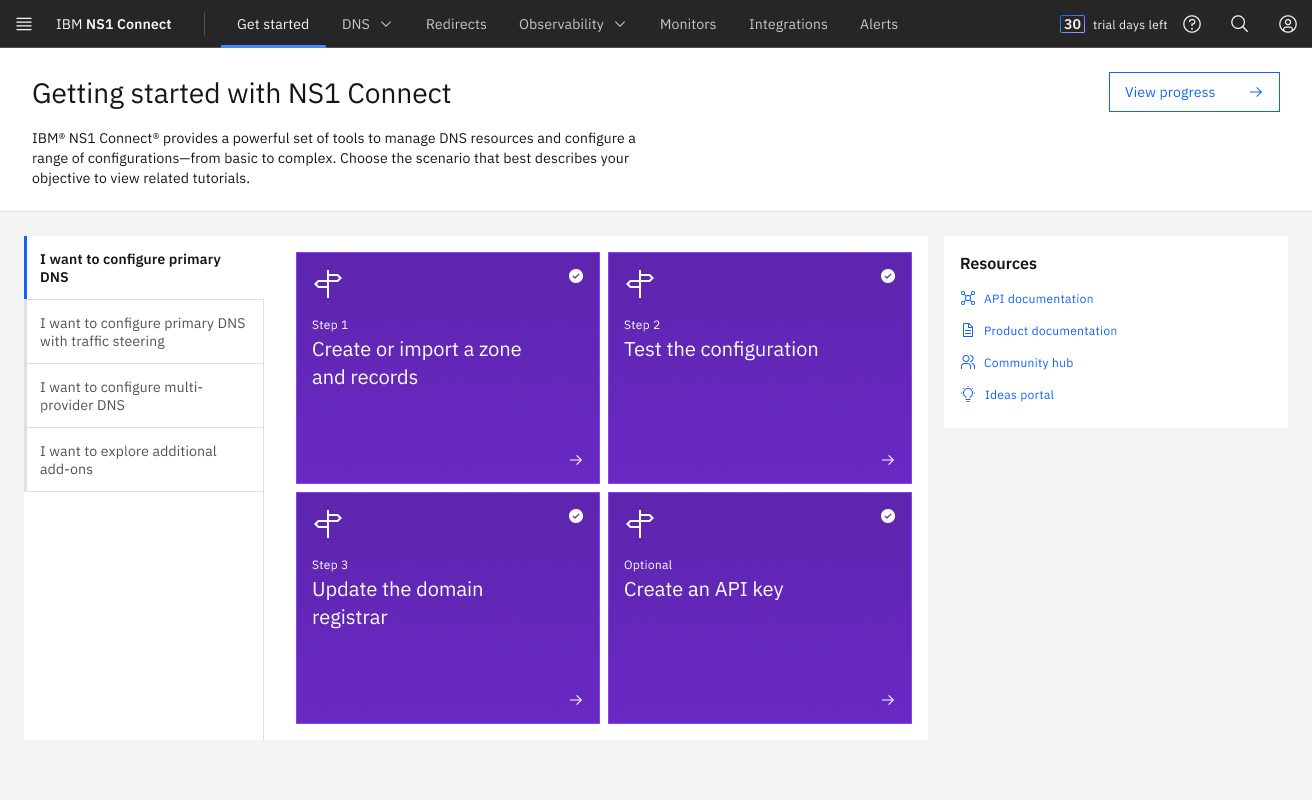
At the time, other NS1 Connect designers were exploring four variations of the Getting Started page. The team had chosen Scenario A, but the other three were still in play, so I prototyped the link in high fidelity in all four. Wherever the page landed, the link would be in the same place.
Outcome & impact
Live in NS1 Connect · July 2026
We presented the work to the NS1 Connect team, and Getting Started became the home for the link. After testing, it launched in NS1 Connect on July 31, 2026, so every customer now sees the Ideas Portal from their first session.
Visits to the Ideas Portal that come from NS1 Connect.
Ideas submitted for NS1 Connect over time.
Fewer duplicate requests, with ideas gathered in one place.
In the product
Video description: on the NS1 Connect Get started page, the pointer moves to the Resources list and clicks Ideas portal. The IBM Ideas site loads and shows the My Ideas page.
03
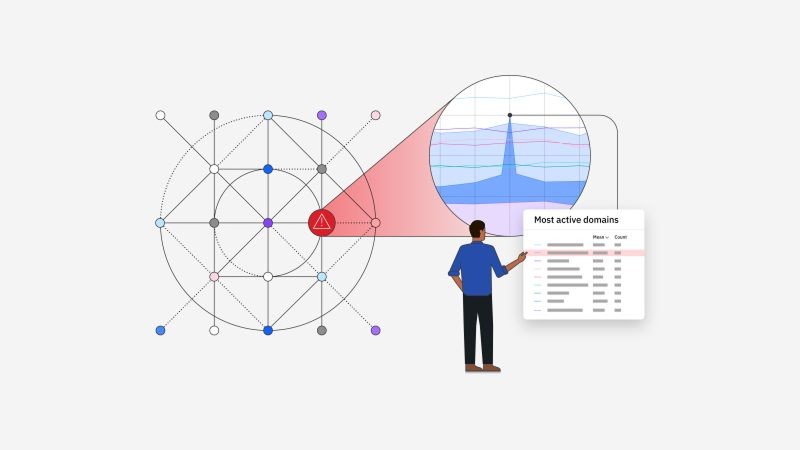
I helped plan and run user research for DNSi (Domain Name System Insights), a product within NS1 Connect. I wrote the research plan and discussion guide, presented them to the product team, and moderated sessions with participants outside IBM.
The goal
The goal was simple: learn how the people who would use the product work today, and hear what they think of an early design.
This work is under NDA, so I’m sharing my process here and leaving the product and the findings out.
My part
Matthew led the study. I owned the planning documents and ran sessions myself.
What we wanted to learn, who to talk to, and how.
The questions and tasks for each session.
A team call with developers and product managers, to align before sessions began.
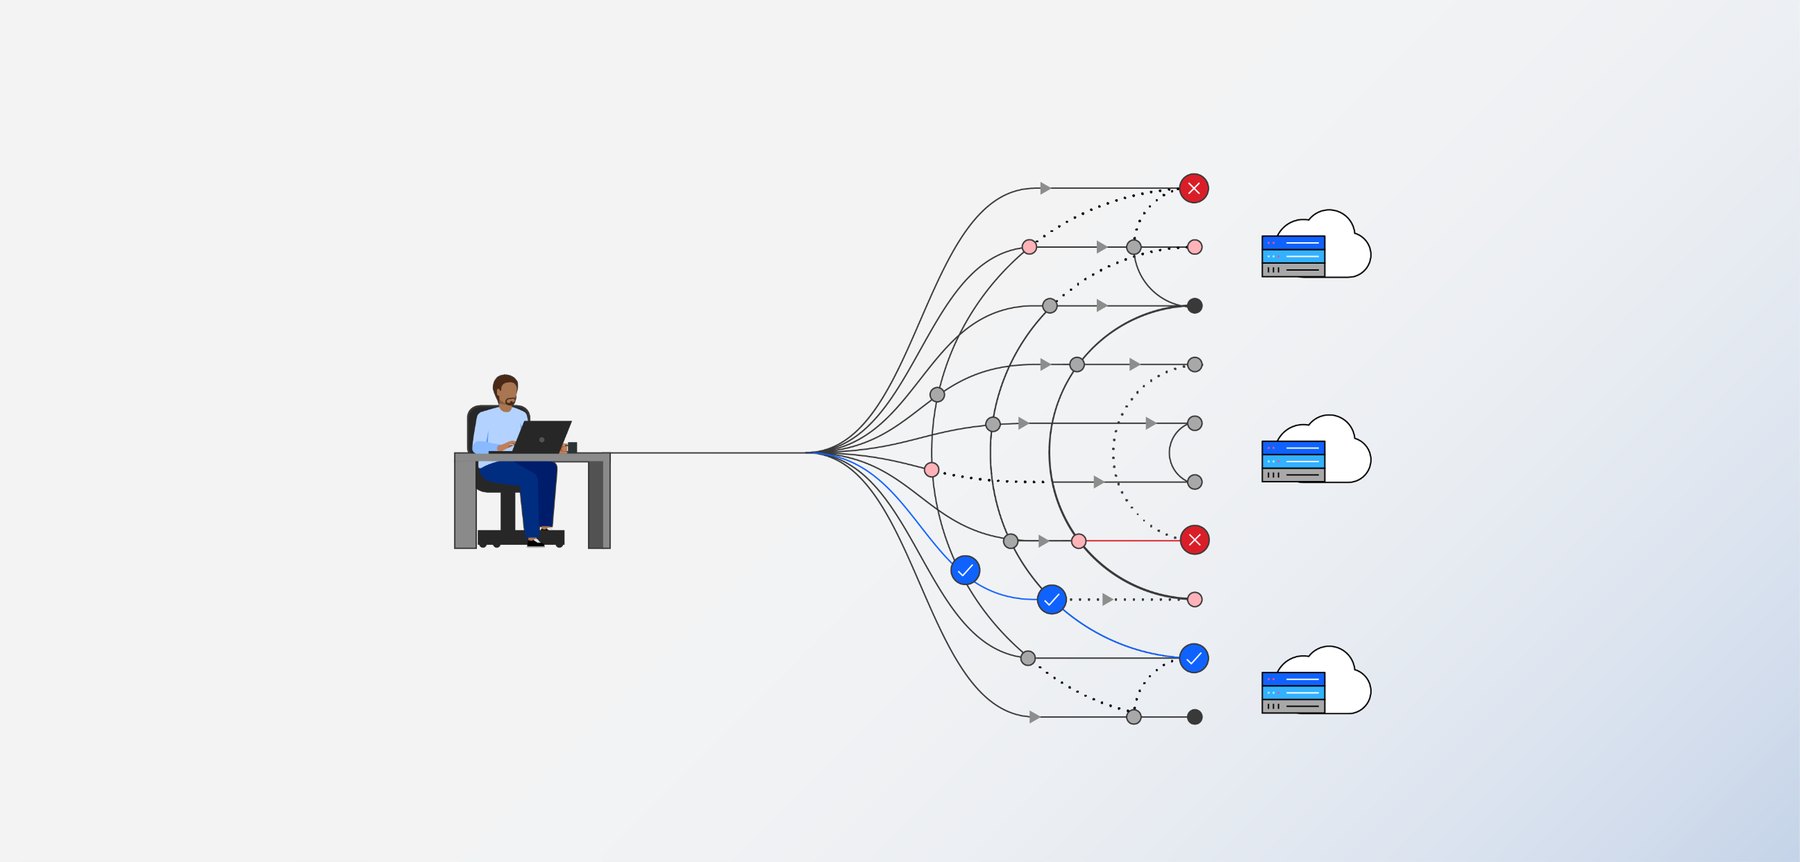
Remote calls with proxy users: professionals outside IBM whose roles match the product’s target users.
What participants said and did, captured for the team’s synthesis.
Session design
Each session had two halves.
1
Open questions about the participant’s role and how they work today.
2
Participants shared their screen, worked through scenarios in a Figma prototype, and thought out loud while I asked follow-up questions.
We spoke with four proxy users in site reliability, DevOps and network engineering roles. They’re kept anonymous here.
What I learned
04
To help the NS1 Connect design team leverage AI to improve work quality and discovery, we studied how design teams across IBM integrate AI into their daily workflows. Based on designer interviews and synthesized findings, we identified key opportunities and mapped out an actionable plan for our team.
The goal
We wanted to create an NS1 Connect Design Team Hub: one place where team members can find every resource, piece of information and project related to our products, along with how-tos for using AI tools. We also wanted AI built into the hub itself, so it could help people find what they need.
Before designing it, we set out to learn how other design teams already use AI, and to find the problem areas that keep designers and the team from working efficiently and finding what they need, from documents to meeting recordings.
Approach
Esther and I ran one-on-one, semi-structured video interviews, following each person’s answers rather than a fixed script.
Every session was recorded with consent and transcribed word for word.
We captured what stood out in each conversation while it was fresh.
We used an IBM Bob skill created by a senior designer at IBM to sort the transcripts and notes into a structured set of findings, putting AI to work on the very topic we were studying.
We grouped related findings across all seven interviews into themes.
We checked every finding against a word-for-word quote in the transcripts, so nothing rested on AI alone.
The themes became insights, then recommendations the team could act on.
What we heard
Every participant is kept anonymous. These are the five points that stood out most across our seven interviews.
1
The team’s information lives across many tools, including Jira, Box, Figma, Mural and Slack, with no single source of truth. Most decisions are made in Slack threads or meetings and never written down anywhere lasting, so they’re hard to find weeks later. In one case, a decision nobody recorded resurfaced at the last minute and sent engineering scrambling.
There’s no single source of truth. When decisions live in chat threads and meetings, the team loses track of what was agreed, and why.
2
Most designers used IBM Bob only as a chat assistant. Five of seven hadn’t tried its more advanced features, like skills that automate repeated tasks or connections to other tools. It wasn’t for lack of interest: each person named a specific obstacle, from unexpected costs and features that disappeared mid-use, to too many options, unclear terms and not knowing where to start.
“I maybe know barely 10% of what Bob can do.”
3
In Figma, designers are used to working in the same file at the same time. AI tools put each person in their own private thread, so work that used to be shared now happens alone. Designers wanted to collaborate inside AI tools too: working in the same IBM Bob file or project, building in the same Figma Make file, and sharing chats and context with teammates. Three of seven asked for this directly.
“I would love to be able to have multiple people in a single AI thread so that we’re all chatting together with the same agents and the same skills.”
4
Two designers had rebuilt how they work around AI, while the other five used it for drafting, summarizing and brainstorming on top of the same process. One of the two had built a whole set of IBM Bob skills, each handling a different part of their research.
It didn’t make their work faster. It made it better: higher quality, a deeper understanding of their research, and more findings than before.
5
Learning to use AI well takes real effort, and designers wanted guidance that respects that. They asked for step-by-step tutorials made for designers, honest examples that show what didn’t work and how it was fixed, and one place to find it all quickly. Two said AI had added to their workload rather than reducing it.
“It actually is a lot of work to learn how to use it well.”
From findings to ideas
Our findings pointed to four opportunity gaps for the team. Esther, Trent and I took them into Mural as four themes, then brainstormed ideas under each one.
To choose where to start, we set up a chart of impact against feasibility, so the ideas that were both valuable and doable would rise to the top.
Recommendations
We closed out the report with recommendations for our team, sorted from quick wins to bigger investments.
What I learned

About
I’m Flynn Coyne, a fourth-year student at Georgia Tech pursuing a B.S. in Industrial Design, with a strong foundation in computer science.
I’m passionate about digital equity and inclusive design, driven by the belief that everyone deserves equal access to opportunities. With a user-centered approach, I design intuitive and accessible experiences.
In spring 2025 I studied product and computational design in Wellington, New Zealand, where I got to learn, fail and grow, as a person and as a designer, well beyond my comfort zone.
I’m excited to keep growing in UI/UX and user research, and to explore new ways to connect culture with technology, using design as a tool for meaningful, positive impact.
Atlanta, GA
Boston, MA